
Note
Go to the end to download the full example code.
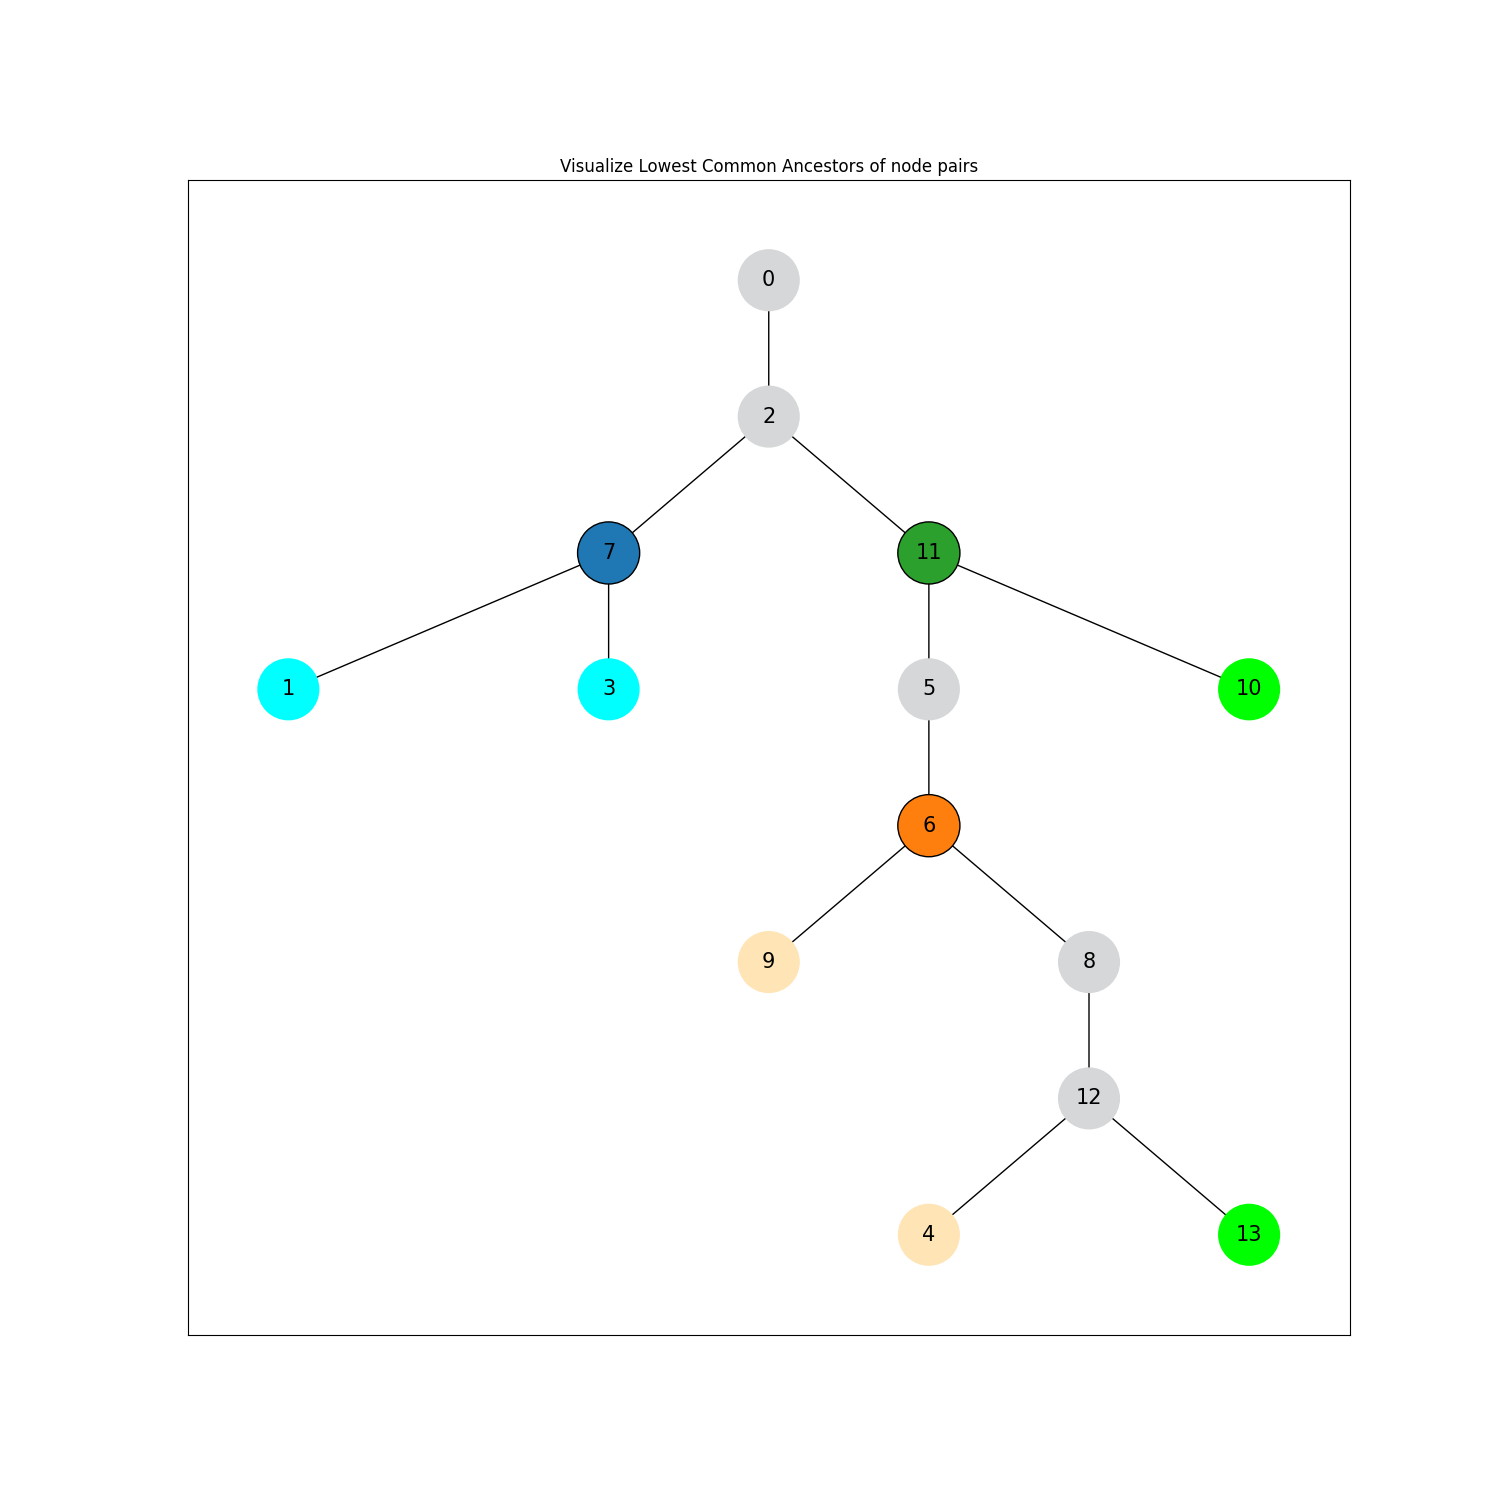
Lowest Common Ancestors#
Compute and visualize LCA for node pairs
In a randomly generated directed tree, the lowest common ancestors are computed for certain node pairs. These node pairs and their LCA are then visualized with a chosen color scheme.
See also
- Lowest Common Ancestor
A more in-depth guide on lowest common ancestor algorithms in NetworkX.
import networkx as nx
import matplotlib.pyplot as plt

G = nx.DiGraph(
    [
        (0, 2),
        (2, 7),
        (2, 11),
        (5, 6),
        (6, 9),
        (6, 8),
        (7, 1),
        (7, 3),
        (8, 12),
        (11, 10),
        (11, 5),
        (12, 4),
        (12, 13),
    ]
)
pos = nx.nx_agraph.graphviz_layout(G, prog="dot")

# Compute lowest-common ancestors for certain node pairs
ancestors = list(nx.all_pairs_lowest_common_ancestor(G, ((1, 3), (4, 9), (13, 10))))

# Create node color and edge color lists
node_colors = ["#D5D7D8" for _ in G]
node_edge_colors = ["None" for _ in G]
node_seq = list(G.nodes)
clr_pairs = (("cyan", "tab:blue"), ("moccasin", "tab:orange"), ("lime", "tab:green"))
for (children, ancestor), (child_clr, anc_clr) in zip(ancestors, clr_pairs):
    for c in children:
        node_colors[node_seq.index(c)] = child_clr
    node_colors[node_seq.index(ancestor)] = anc_clr
    node_edge_colors[node_seq.index(ancestor)] = "black"

# Plot tree
plt.figure(figsize=(15, 15))
plt.title("Visualize Lowest Common Ancestors of node pairs")
nx.draw_networkx_nodes(
    G, pos, node_color=node_colors, node_size=2000, edgecolors=node_edge_colors
)
nx.draw_networkx_edges(G, pos)
nx.draw_networkx_labels(G, pos, font_size=15)
plt.show()
Total running time of the script: (0 minutes 0.133 seconds)