This page is documentation for a DEVELOPMENT / PRE-RELEASE version. Switch to stable version
Ctrl+K
Logo image

Site Navigation

  • Install
  • Tutorial
  • Reference
  • Gallery
  • Developer
  • Releases
  • Guides
  • Home Page
  • GitHub
    • devel (latest)
    • current (stable)

Site Navigation

  • Install
  • Tutorial
  • Reference
  • Gallery
  • Developer
  • Releases
  • Guides
  • Home Page
  • GitHub
    • devel (latest)
    • current (stable)

Section Navigation

  • Basic
  • Drawing
    • Custom Node Position
    • Chess Masters
    • Custom node icons
    • Degree Analysis
    • Directed Graph
    • Edge Colormap
    • Ego Graph
    • Eigenvalues
    • Four Grids
    • House With Colors
    • Knuth Miles
    • Labels And Colors
    • Multipartite Layout
    • Node Colormap
    • Rainbow Coloring
    • Random Geometric Graph
    • Sampson
    • Self-loops
    • Simple Path
    • Spectral Embedding
    • Traveling Salesman Problem
    • Unix Email
    • Weighted Graph
  • 3D Drawing
  • Graphviz Layout
  • Graphviz Drawing
  • Graph
  • Algorithms
  • External libraries
  • Geospatial
  • Subclass
  • Gallery
  • Drawing
  • Simple Path

Note

Go to the end to download the full example code

Simple Path#

Draw a graph with matplotlib.
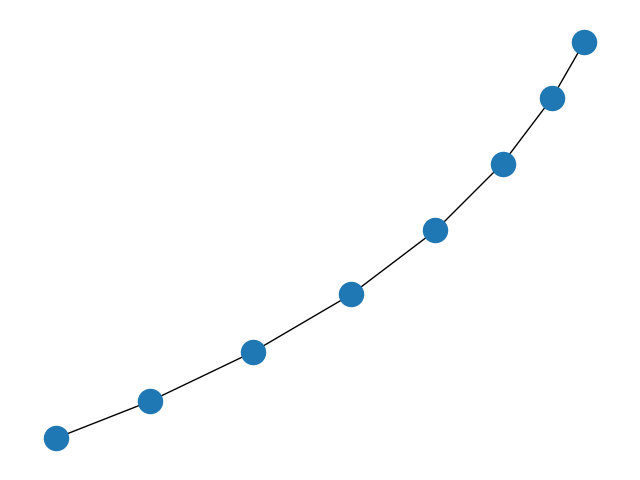
plot simple path
import matplotlib.pyplot as plt
import networkx as nx

G = nx.path_graph(8)
pos = nx.spring_layout(G, seed=47)  # Seed layout for reproducibility
nx.draw(G, pos=pos)
plt.show()

Total running time of the script: (0 minutes 0.054 seconds)

Download Python source code: plot_simple_path.py

Download Jupyter notebook: plot_simple_path.ipynb

Gallery generated by Sphinx-Gallery

Ctrl+K

© Copyright 2004-2023, NetworkX Developers.

Created using Sphinx 7.2.6.

Built with the PyData Sphinx Theme 0.14.1.