
Note
Go to the end to download the full example code.
Eigenvalues#
Create an G{n,m} random graph and compute the eigenvalues.
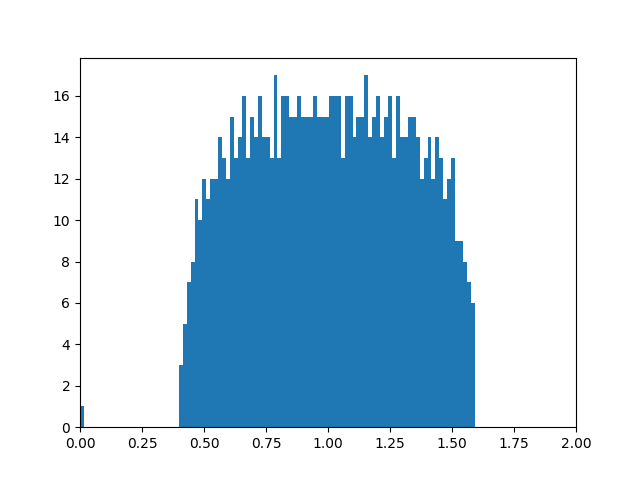
Largest eigenvalue: (1.5924617911775822+0j)
Smallest eigenvalue: (1.0871809604758114e-17+0j)
/home/runner/work/networkx/networkx/.pixi/envs/docs/lib/python3.12/site-packages/matplotlib/cbook.py:1811: ComplexWarning: Casting complex values to real discards the imaginary part
  return math.isfinite(val)
/home/runner/work/networkx/networkx/.pixi/envs/docs/lib/python3.12/site-packages/numpy/lib/_histograms_impl.py:853: ComplexWarning: Casting complex values to real discards the imaginary part
  indices = f_indices.astype(np.intp)
/home/runner/work/networkx/networkx/.pixi/envs/docs/lib/python3.12/site-packages/matplotlib/axes/_axes.py:7518: ComplexWarning: Casting complex values to real discards the imaginary part
  bins = np.array(bins, float)  # causes problems if float16
import matplotlib.pyplot as plt
import networkx as nx
import numpy as np

n = 1000  # 1000 nodes
m = 5000  # 5000 edges
G = nx.gnm_random_graph(n, m, seed=5040)  # Seed for reproducibility

L = nx.normalized_laplacian_matrix(G)
e = np.linalg.eigvals(L.toarray())
print("Largest eigenvalue:", max(e))
print("Smallest eigenvalue:", min(e))
plt.hist(e, bins=100)  # histogram with 100 bins
plt.xlim(0, 2)  # eigenvalues between 0 and 2
plt.show()
Total running time of the script: (0 minutes 0.324 seconds)