
Note
Go to the end to download the full example code.
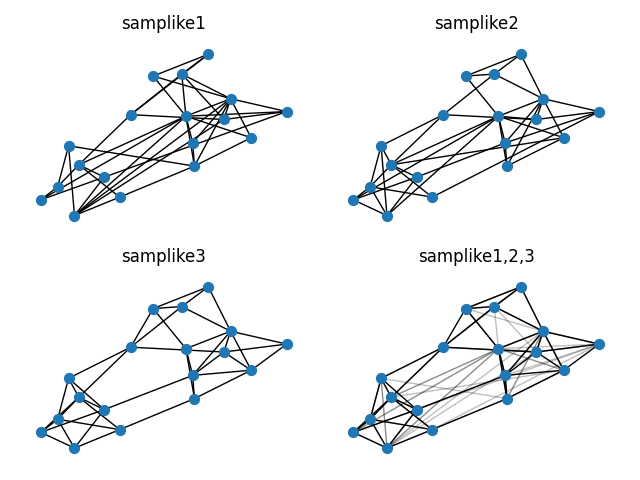
Sampson#
Sampson’s monastery data.
Shows how to read data from a zip file and plot multiple frames.
The data file can be found at:
import zipfile

import matplotlib.pyplot as plt
import networkx as nx

# Extract the edge data for the 3 sampson-like graphs from the archive
with zipfile.ZipFile("sampson_data.zip") as zf:
    G1, G2, G3 = [
        nx.parse_edgelist(
            zf.read(f"samplike{n}.txt").decode().split("\n"), delimiter="\t"
        )
        for n in (1, 2, 3)
    ]

# Use the same layout for all 3 examples
pos = nx.spring_layout(G3, iterations=100, seed=173)

fig, axes = plt.subplots(2, 2)
plot_opts = {"node_size": 50, "with_labels": False}

# Plot each graph individually
for num, (G, ax) in enumerate(zip((G1, G2, G3), axes.ravel()), start=1):
    nx.draw(G, pos, ax=ax, **plot_opts)
    ax.set_title(f"samplike{num}")

# In the last frame, plot all 3 graphs together
ax = axes[1, 1]
nx.draw_networkx_nodes(G3, pos, ax=ax, node_size=50)
for G, edge_clr in zip((G1, G2, G3), "rgb"):
    nx.draw_networkx_edges(G, pos, ax=ax, edge_color=edge_clr)

ax.set_title("samplike1,2,3")
ax.set_axis_off()
plt.tight_layout()
plt.show()
Total running time of the script: (0 minutes 0.087 seconds)