
Note
Go to the end to download the full example code.
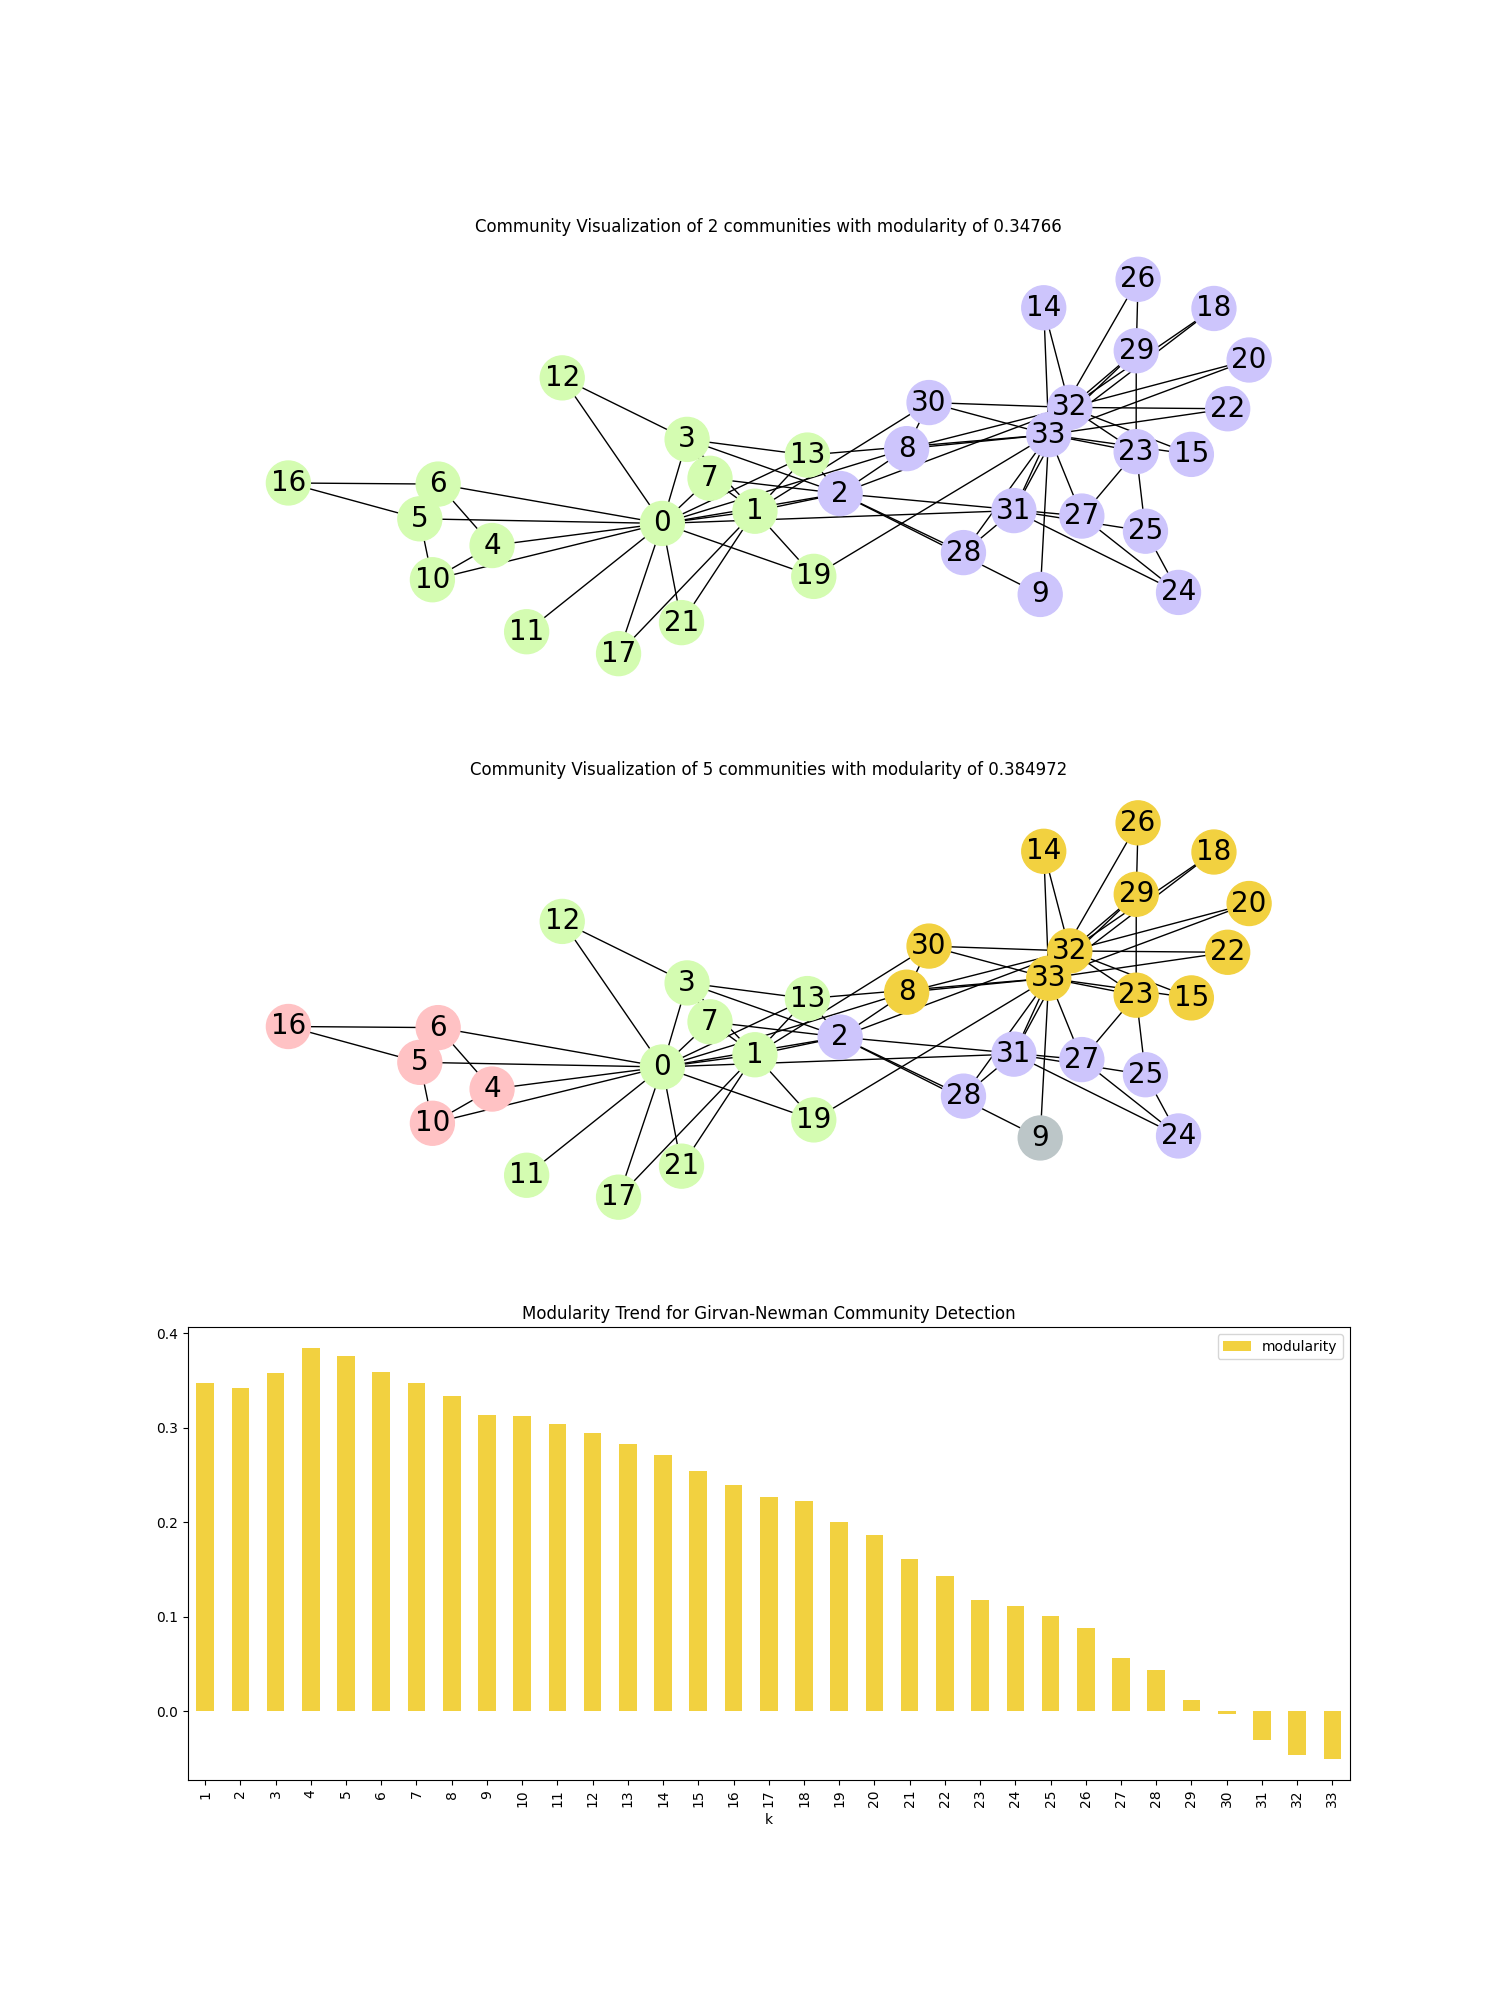
Community Detection using Girvan-Newman#
This example shows the detection of communities in the Zachary Karate Club dataset using the Girvan-Newman method.
We plot the change in modularity as important edges are removed. Graph is coloured and plotted based on community detection when number of iterations are 1 and 4 respectively.
import networkx as nx
import pandas as pd
import matplotlib.pyplot as plt

# Load karate graph and find communities using Girvan-Newman
G = nx.karate_club_graph()
communities = list(nx.community.girvan_newman(G))

# Modularity -> measures the strength of division of a network into modules
modularity_df = pd.DataFrame(
    [
        [k + 1, nx.community.modularity(G, communities[k])]
        for k in range(len(communities))
    ],
    columns=["k", "modularity"],
)


# function to create node colour list
def create_community_node_colors(graph, communities):
    number_of_colors = len(communities)
    colors = ["#D4FCB1", "#CDC5FC", "#FFC2C4", "#F2D140", "#BCC6C8"][:number_of_colors]
    node_colors = []
    for node in graph:
        current_community_index = 0
        for community in communities:
            if node in community:
                node_colors.append(colors[current_community_index])
                break
            current_community_index += 1
    return node_colors


# function to plot graph with node colouring based on communities
def visualize_communities(graph, communities, i):
    node_colors = create_community_node_colors(graph, communities)
    modularity = round(nx.community.modularity(graph, communities), 6)
    title = f"Community Visualization of {len(communities)} communities with modularity of {modularity}"
    pos = nx.spring_layout(graph, k=0.3, iterations=50, seed=2)
    plt.subplot(3, 1, i)
    plt.title(title)
    nx.draw(
        graph,
        pos=pos,
        node_size=1000,
        node_color=node_colors,
        with_labels=True,
        font_size=20,
        font_color="black",
    )


fig, ax = plt.subplots(3, figsize=(15, 20))

# Plot graph with colouring based on communities
visualize_communities(G, communities[0], 1)
visualize_communities(G, communities[3], 2)

# Plot change in modularity as the important edges are removed
modularity_df.plot.bar(
    x="k",
    ax=ax[2],
    color="#F2D140",
    title="Modularity Trend for Girvan-Newman Community Detection",
)
plt.show()
Total running time of the script: (0 minutes 0.463 seconds)