
Note
Go to the end to download the full example code.
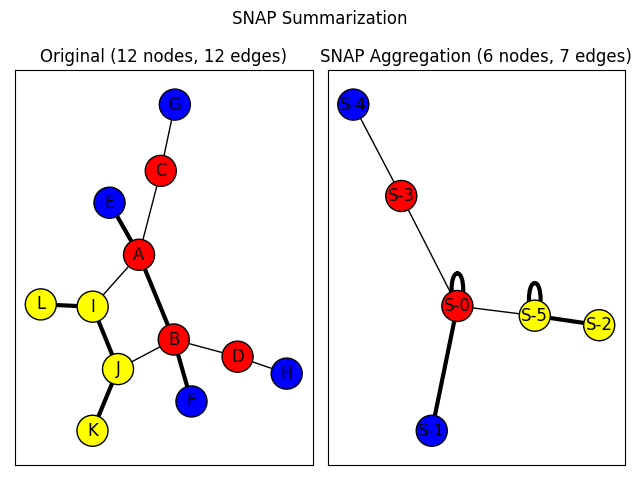
SNAP Graph Summary#
An example of summarizing a graph based on node attributes and edge attributes using the Summarization by Grouping Nodes on Attributes and Pairwise edges (SNAP) algorithm (not to be confused with the Stanford Network Analysis Project). The algorithm groups nodes by their unique combinations of node attribute values and edge types with other groups of nodes to produce a summary graph. The summary graph can then be used to infer how nodes with different attributes values relate to other nodes in the graph.
import networkx as nx
import matplotlib.pyplot as plt


nodes = {
    "A": {"color": "Red"},
    "B": {"color": "Red"},
    "C": {"color": "Red"},
    "D": {"color": "Red"},
    "E": {"color": "Blue"},
    "F": {"color": "Blue"},
    "G": {"color": "Blue"},
    "H": {"color": "Blue"},
    "I": {"color": "Yellow"},
    "J": {"color": "Yellow"},
    "K": {"color": "Yellow"},
    "L": {"color": "Yellow"},
}
edges = [
    ("A", "B", "Strong"),
    ("A", "C", "Weak"),
    ("A", "E", "Strong"),
    ("A", "I", "Weak"),
    ("B", "D", "Weak"),
    ("B", "J", "Weak"),
    ("B", "F", "Strong"),
    ("C", "G", "Weak"),
    ("D", "H", "Weak"),
    ("I", "J", "Strong"),
    ("J", "K", "Strong"),
    ("I", "L", "Strong"),
]
original_graph = nx.Graph()
original_graph.add_nodes_from(n for n in nodes.items())
original_graph.add_edges_from((u, v, {"type": label}) for u, v, label in edges)


plt.suptitle("SNAP Summarization")

base_options = {"with_labels": True, "edgecolors": "black", "node_size": 500}

ax1 = plt.subplot(1, 2, 1)
plt.title(
    f"Original ({original_graph.number_of_nodes()} nodes, {original_graph.number_of_edges()} edges)"
)
pos = nx.spring_layout(original_graph, seed=7482934)
node_colors = [d["color"] for _, d in original_graph.nodes(data=True)]

edge_type_visual_weight_lookup = {"Weak": 1.0, "Strong": 3.0}
edge_weights = [
    edge_type_visual_weight_lookup[d["type"]]
    for _, _, d in original_graph.edges(data=True)
]

nx.draw_networkx(
    original_graph, pos=pos, node_color=node_colors, width=edge_weights, **base_options
)

node_attributes = ("color",)
edge_attributes = ("type",)
summary_graph = nx.snap_aggregation(
    original_graph, node_attributes, edge_attributes, prefix="S-"
)

plt.subplot(1, 2, 2)

plt.title(
    f"SNAP Aggregation ({summary_graph.number_of_nodes()} nodes, {summary_graph.number_of_edges()} edges)"
)
summary_pos = nx.spring_layout(summary_graph, seed=8375428)
node_colors = []
for node in summary_graph:
    color = summary_graph.nodes[node]["color"]
    node_colors.append(color)

edge_weights = []
for edge in summary_graph.edges():
    edge_types = summary_graph.get_edge_data(*edge)["types"]
    edge_weight = 0.0
    for edge_type in edge_types:
        edge_weight += edge_type_visual_weight_lookup[edge_type["type"]]
    edge_weights.append(edge_weight)

nx.draw_networkx(
    summary_graph,
    pos=summary_pos,
    node_color=node_colors,
    width=edge_weights,
    **base_options,
)

plt.tight_layout()
plt.show()
Total running time of the script: (0 minutes 0.155 seconds)