
Note
Go to the end to download the full example code.
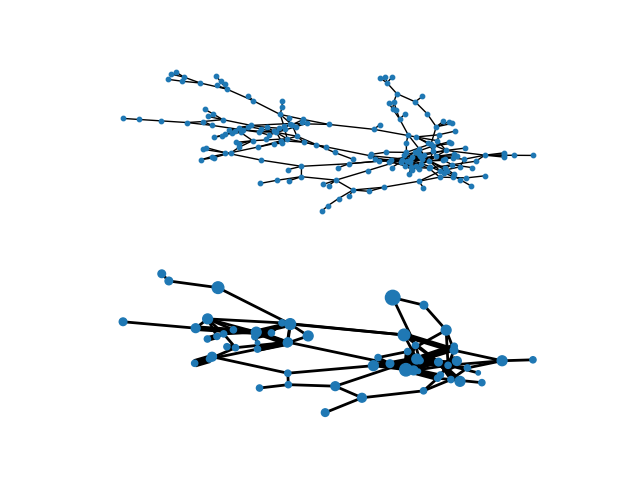
Blockmodel#
Example of creating a block model using the quotient_graph function in NX. Data used is the Hartford, CT drug users network:
@article{weeks2002social,
  title={Social networks of drug users in high-risk sites: Finding the connections},
  url = {https://doi.org/10.1023/A:1015457400897},
  doi = {10.1023/A:1015457400897},
  author={Weeks, Margaret R and Clair, Scott and Borgatti, Stephen P and Radda, Kim and Schensul, Jean J},
  journal={{AIDS and Behavior}},
  volume={6},
  number={2},
  pages={193--206},
  year={2002},
  publisher={Springer}
}
from collections import defaultdict

import matplotlib.pyplot as plt
import networkx as nx
import numpy as np
import scipy as sp


def create_hc(G):
    """Creates hierarchical cluster of graph G from distance matrix"""
    path_length = nx.all_pairs_shortest_path_length(G)
    distances = np.zeros((len(G), len(G)))
    for u, p in path_length:
        for v, d in p.items():
            distances[u][v] = d
    # Create hierarchical cluster
    Y = sp.spatial.distance.squareform(distances)
    Z = sp.cluster.hierarchy.complete(Y)  # Creates HC using farthest point linkage
    # This partition selection is arbitrary, for illustrative purposes
    membership = list(sp.cluster.hierarchy.fcluster(Z, t=1.15))
    # Create collection of lists for blockmodel
    partition = defaultdict(list)
    for n, p in zip(list(range(len(G))), membership):
        partition[p].append(n)
    return list(partition.values())


G = nx.read_edgelist("hartford_drug.edgelist")

# Extract largest connected component into graph H
H = G.subgraph(next(nx.connected_components(G)))
# Makes life easier to have consecutively labeled integer nodes
H = nx.convert_node_labels_to_integers(H)
# Create partitions with hierarchical clustering
partitions = create_hc(H)
# Build blockmodel graph
BM = nx.quotient_graph(H, partitions, relabel=True)

# Draw original graph
pos = nx.spring_layout(H, iterations=100, seed=83)  # Seed for reproducibility
plt.subplot(211)
nx.draw(H, pos, with_labels=False, node_size=10)

# Draw block model with weighted edges and nodes sized by number of internal nodes
node_size = [BM.nodes[x]["nnodes"] * 10 for x in BM.nodes()]
edge_width = [(2 * d["weight"]) for (u, v, d) in BM.edges(data=True)]
# Set positions to mean of positions of internal nodes from original graph
posBM = {}
for n in BM:
    xy = np.array([pos[u] for u in BM.nodes[n]["graph"]])
    posBM[n] = xy.mean(axis=0)
plt.subplot(212)
nx.draw(BM, posBM, node_size=node_size, width=edge_width, with_labels=False)
plt.axis("off")
plt.show()
Total running time of the script: (0 minutes 0.285 seconds)