
Note
Go to the end to download the full example code.
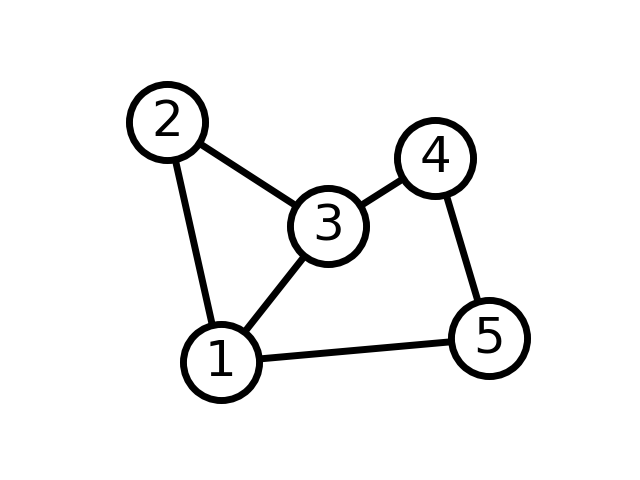
Simple graph#
Draw simple graph with manual layout.
import networkx as nx
import matplotlib.pyplot as plt

G = nx.Graph([(1, 2), (1, 3), (1, 5), (2, 3), (3, 4), (4, 5)])

# explicitly set positions
pos = {1: (0, 0), 2: (-1, 0.3), 3: (2, 0.17), 4: (4, 0.255), 5: (5, 0.03)}

options = {
    "font_size": 36,
    "node_size": 3000,
    "node_color": "white",
    "edgecolors": "black",
    "linewidths": 5,
    "width": 5,
}
nx.draw(G, pos, with_labels=True, **options)
plt.show()
Total running time of the script: (0 minutes 0.031 seconds)