
Note
Go to the end to download the full example code.
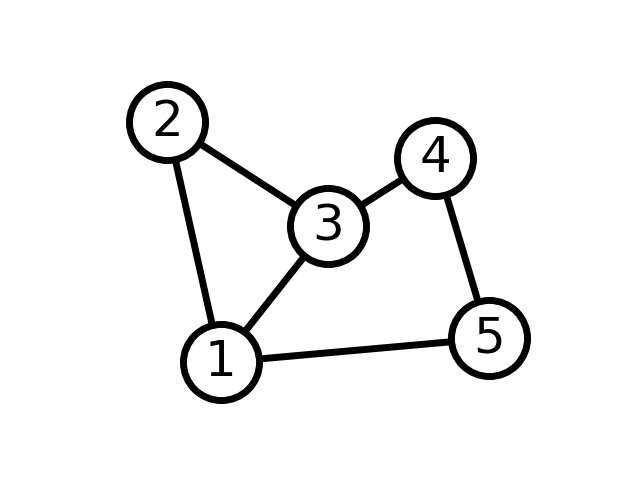
Simple graph#
Draw simple graph with manual layout.
import networkx as nx
import matplotlib.pyplot as plt

G = nx.Graph()
G.add_edge(1, 2)
G.add_edge(1, 3)
G.add_edge(1, 5)
G.add_edge(2, 3)
G.add_edge(3, 4)
G.add_edge(4, 5)

# explicitly set positions
pos = {1: (0, 0), 2: (-1, 0.3), 3: (2, 0.17), 4: (4, 0.255), 5: (5, 0.03)}

options = {
    "font_size": 36,
    "node_size": 3000,
    "node_color": "white",
    "edgecolors": "black",
    "linewidths": 5,
    "width": 5,
}
nx.draw_networkx(G, pos, **options)

# Set margins for the axes so that nodes aren't clipped
ax = plt.gca()
ax.margins(0.20)
plt.axis("off")
plt.show()
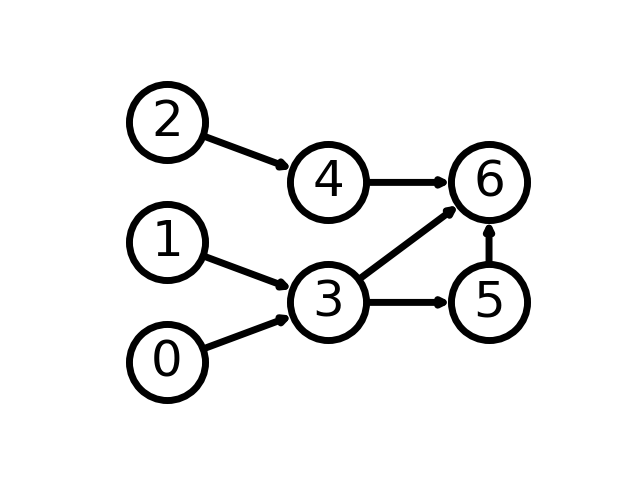
A directed graph
G = nx.DiGraph([(0, 3), (1, 3), (2, 4), (3, 5), (3, 6), (4, 6), (5, 6)])

# group nodes by column
left_nodes = [0, 1, 2]
middle_nodes = [3, 4]
right_nodes = [5, 6]

# set the position according to column (x-coord)
pos = {n: (0, i) for i, n in enumerate(left_nodes)}
pos.update({n: (1, i + 0.5) for i, n in enumerate(middle_nodes)})
pos.update({n: (2, i + 0.5) for i, n in enumerate(right_nodes)})

nx.draw_networkx(G, pos, **options)

# Set margins for the axes so that nodes aren't clipped
ax = plt.gca()
ax.margins(0.20)
plt.axis("off")
plt.show()
Total running time of the script: (0 minutes 0.090 seconds)