
Note
Go to the end to download the full example code.
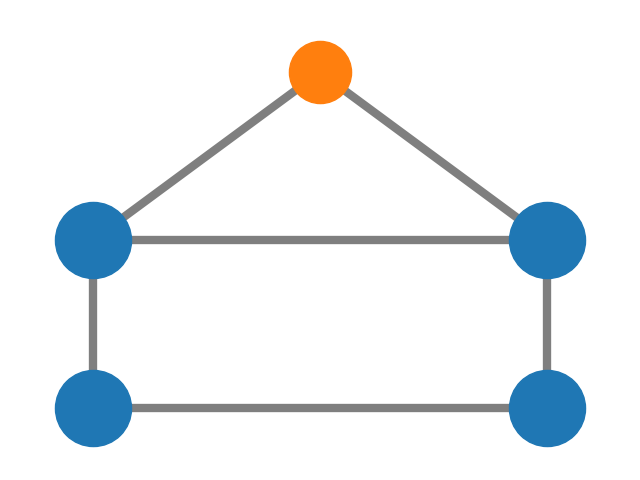
House With Colors#
Draw a graph with matplotlib.
import matplotlib.pyplot as plt
import networkx as nx

G = nx.house_graph()
# explicitly set positions
pos = {0: (0, 0), 1: (1, 0), 2: (0, 1), 3: (1, 1), 4: (0.5, 2.0)}

# Plot nodes with different properties for the "wall" and "roof" nodes
nx.draw_networkx_nodes(
    G, pos, node_size=3000, nodelist=[0, 1, 2, 3], node_color="tab:blue"
)
nx.draw_networkx_nodes(G, pos, node_size=2000, nodelist=[4], node_color="tab:orange")
nx.draw_networkx_edges(G, pos, alpha=0.5, width=6)
# Customize axes
ax = plt.gca()
ax.margins(0.11)
plt.tight_layout()
plt.axis("off")
plt.show()
Total running time of the script: (0 minutes 0.059 seconds)