
Note
Go to the end to download the full example code.
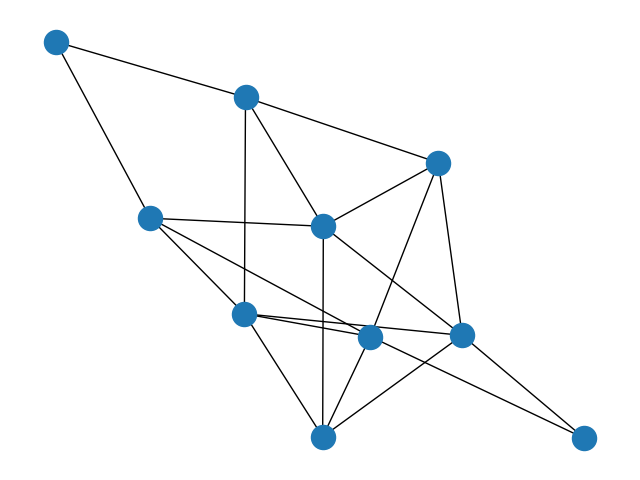
Erdos Renyi#
Create an G{n,m} random graph with n nodes and m edges and report some properties.
This graph is sometimes called the Erdős-Rényi graph but is different from G{n,p} or binomial_graph which is also sometimes called the Erdős-Rényi graph.
node degree clustering
0 4 0.3333333333333333
1 5 0.3
2 4 0.16666666666666666
3 4 0.5
4 4 0.16666666666666666
5 2 0
6 2 0
7 5 0.3
8 5 0.2
9 5 0.3

the adjacency list
0 8 2 9 1
1 2 4 9 3
2 7 6
3 9 8 7
4 7 6 8
5 8 9
6
7 9 8
8
9
import matplotlib.pyplot as plt
import networkx as nx

n = 10  # 10 nodes
m = 20  # 20 edges
seed = 20160  # seed random number generators for reproducibility

# Use seed for reproducibility
G = nx.gnm_random_graph(n, m, seed=seed)

# some properties
print("node degree clustering")
for v in nx.nodes(G):
    print(f"{v} {nx.degree(G, v)} {nx.clustering(G, v)}")

print()
print("the adjacency list")
for line in nx.generate_adjlist(G):
    print(line)

pos = nx.spring_layout(G, seed=seed)  # Seed for reproducible layout
nx.draw(G, pos=pos)
plt.show()
Total running time of the script: (0 minutes 0.036 seconds)