
Note
Go to the end to download the full example code.
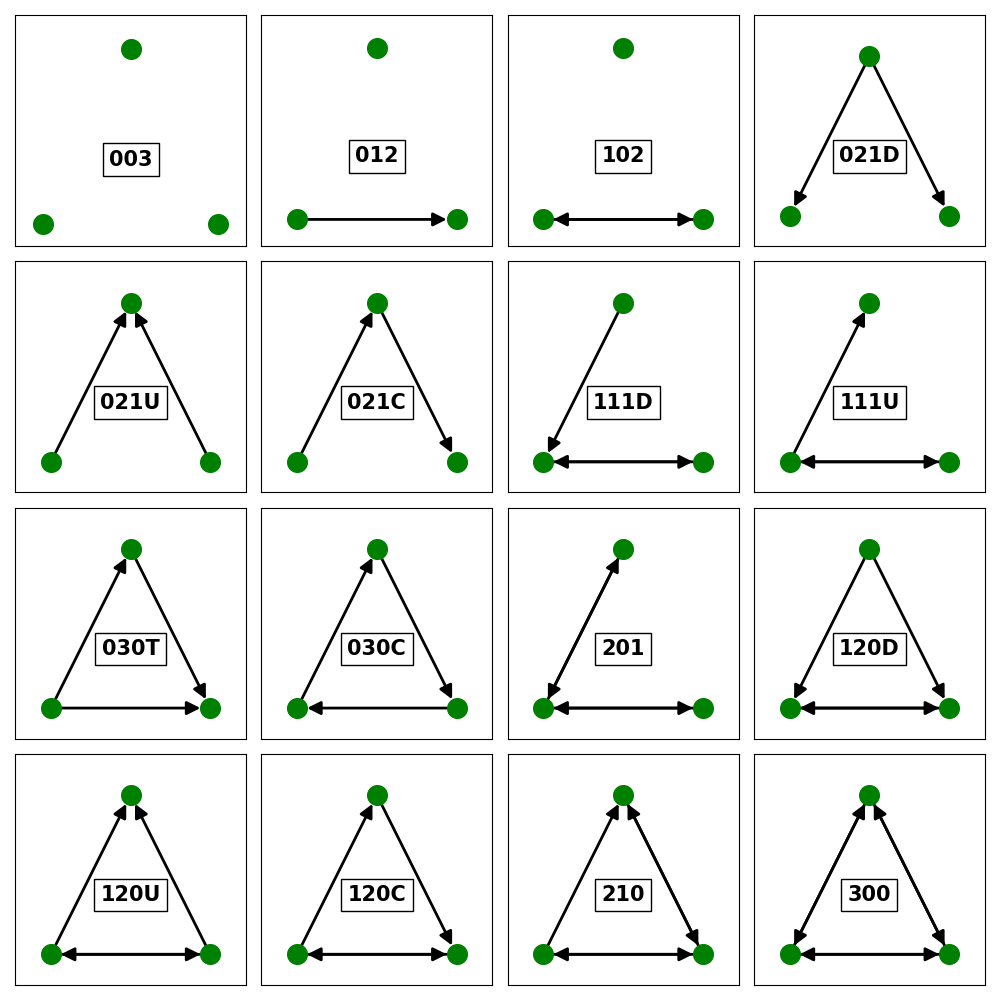
Triads#
According to the paper by Snijders, T. (2012). “Transitivity and triads.” University of Oxford, there are 16 Triad Types possible. This plot shows the 16 Triad Types that can be identified within directed networks. Triadic relationships are especially useful when analysing Social Networks. The first three digits refer to the number of mutual, asymmetric and null dyads (bidirectional, unidirection and nonedges) and the letter gives the Orientation as Up (U), Down (D) , Cyclical (C) or Transitive (T).
import networkx as nx
import matplotlib.pyplot as plt

fig, axes = plt.subplots(4, 4, figsize=(10, 10))
triads = {
    "003": [],
    "012": [(1, 2)],
    "102": [(1, 2), (2, 1)],
    "021D": [(3, 1), (3, 2)],
    "021U": [(1, 3), (2, 3)],
    "021C": [(1, 3), (3, 2)],
    "111D": [(1, 2), (2, 1), (3, 1)],
    "111U": [(1, 2), (2, 1), (1, 3)],
    "030T": [(1, 2), (3, 2), (1, 3)],
    "030C": [(1, 3), (3, 2), (2, 1)],
    "201": [(1, 2), (2, 1), (3, 1), (1, 3)],
    "120D": [(1, 2), (2, 1), (3, 1), (3, 2)],
    "120U": [(1, 2), (2, 1), (1, 3), (2, 3)],
    "120C": [(1, 2), (2, 1), (1, 3), (3, 2)],
    "210": [(1, 2), (2, 1), (1, 3), (3, 2), (2, 3)],
    "300": [(1, 2), (2, 1), (2, 3), (3, 2), (1, 3), (3, 1)],
}

for (title, triad), ax in zip(triads.items(), axes.flatten()):
    G = nx.DiGraph()
    G.add_nodes_from([1, 2, 3])
    G.add_edges_from(triad)
    nx.draw_networkx(
        G,
        ax=ax,
        with_labels=False,
        node_color=["green"],
        node_size=200,
        arrowsize=20,
        width=2,
        pos=nx.planar_layout(G),
    )
    ax.set_xlim(val * 1.2 for val in ax.get_xlim())
    ax.set_ylim(val * 1.2 for val in ax.get_ylim())
    ax.text(
        0,
        0,
        title,
        fontsize=15,
        fontweight="extra bold",
        horizontalalignment="center",
        bbox={"boxstyle": "square,pad=0.3", "fc": "none"},
    )
fig.tight_layout()
plt.show()
Total running time of the script: (0 minutes 0.937 seconds)