
Note
Go to the end to download the full example code.
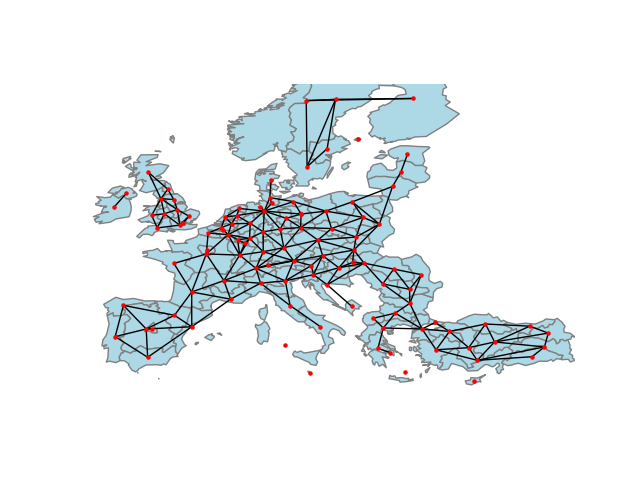
Graphs from Polygons#
This example shows how to build a graph from a set of polygons using PySAL and geopandas. We’ll focus on the Queen contiguity graph, but constructors are also provided for Rook contiguity, as well as other kinds of graphs from the polygon centroids.
from libpysal import weights
import matplotlib.pyplot as plt
import networkx as nx
import geopandas
import numpy as np

# read in example data from geojson. GeoJSON is a file format
# for encoding geographic data based on JSON. It is useful for
# presenting geographic data on the web, and is increasingly
# used as a file format for geographic data.
filepath = "nuts1.geojson"
european_regions = geopandas.read_file(filepath)

# extract the centroids for connecting the regions, which is
# the average of the coordinates that define the polygon's boundary
centroids = np.column_stack((european_regions.centroid.x, european_regions.centroid.y))

# construct the "Queen" adjacency graph. In geographical applications,
# the "Queen" adjacency graph considers two polygons as connected if
# they share a single point on their boundary. This is an analogue to
# the "Moore" neighborhood nine surrounding cells in a regular grid.
queen = weights.Queen.from_dataframe(european_regions)

# Then, we can convert the graph to networkx object using the
# .to_networkx() method.
graph = queen.to_networkx()

# To plot with networkx, we need to merge the nodes back to
# their positions in order to plot in networkx
positions = dict(zip(graph.nodes, centroids))

# plot with a nice basemap
ax = european_regions.plot(linewidth=1, edgecolor="grey", facecolor="lightblue")
ax.axis([-12, 45, 33, 66])
ax.axis("off")
nx.draw(graph, positions, ax=ax, node_size=5, node_color="r")
plt.show()

# An alternative method to construct graphs from polygons may use
# pygeos. This package is a high-performance interface to the GEOS C
# library, used in computing geographical relationships. These let us
# describe the relationships between "point sets," like polygons whether
# or not a line "crosses" a polygon, or whether two polygons "touch."
# These relationships, called "predicates", are extensive, and are documented
# by the pygeos package.
Total running time of the script: (0 minutes 0.348 seconds)