
Note
Go to the end to download the full example code.
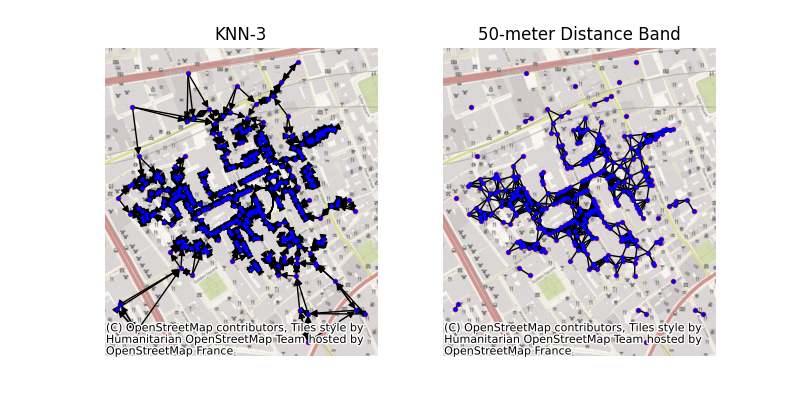
Graphs from geographic points#
This example shows how to build a graph from a set of points using PySAL and geopandas. In this example, we’ll use the famous set of cholera cases at the Broad Street Pump, recorded by John Snow in 1853. The methods shown here can also work directly with polygonal data using their centroids as representative points.
from libpysal import weights, examples
from contextily import add_basemap
import matplotlib.pyplot as plt
import networkx as nx
import numpy as np
import geopandas

# read in example data from a geopackage file. Geopackages
# are a format for storing geographic data that is backed
# by sqlite. geopandas reads data relying on the fiona package,
# providing a high-level pandas-style interface to geographic data.
cases = geopandas.read_file("cholera_cases.gpkg")

# construct the array of coordinates for the centroid
coordinates = np.column_stack((cases.geometry.x, cases.geometry.y))

# construct two different kinds of graphs:

## 3-nearest neighbor graph, meaning that points are connected
## to the three closest other points. This means every point
## will have exactly three neighbors.
knn3 = weights.KNN.from_dataframe(cases, k=3)

## The 50-meter distance band graph will connect all pairs of points
## that are within 50 meters from one another. This means that points
## may have different numbers of neighbors.
dist = weights.DistanceBand.from_array(coordinates, threshold=50)

# Then, we can convert the graph to networkx object using the
# .to_networkx() method.
knn_graph = knn3.to_networkx()
dist_graph = dist.to_networkx()

# To plot with networkx, we need to merge the nodes back to
# their positions in order to plot in networkx
positions = dict(zip(knn_graph.nodes, coordinates))

# plot with a nice basemap
f, ax = plt.subplots(1, 2, figsize=(8, 4))
for i, facet in enumerate(ax):
    cases.plot(marker=".", color="orangered", ax=facet)
    try:  # For issues with downloading/parsing basemaps in CI
        add_basemap(facet)
    except:
        pass
    facet.set_title(("KNN-3", "50-meter Distance Band")[i])
    facet.axis("off")
nx.draw(knn_graph, positions, ax=ax[0], node_size=5, node_color="b")
nx.draw(dist_graph, positions, ax=ax[1], node_size=5, node_color="b")
plt.show()
Total running time of the script: (0 minutes 2.427 seconds)