
Note
Go to the end to download the full example code.
Graphs from a set of lines#
This example shows how to build a graph from a set of geographic lines (sometimes called “linestrings”) using GeoPandas, momepy and alternatively PySAL. We’ll plot some rivers and streets, as well as their graphs formed from the segments.
There are generally two ways of creating graph object from line geometry. Let’s use an example of street network to illustrate both:
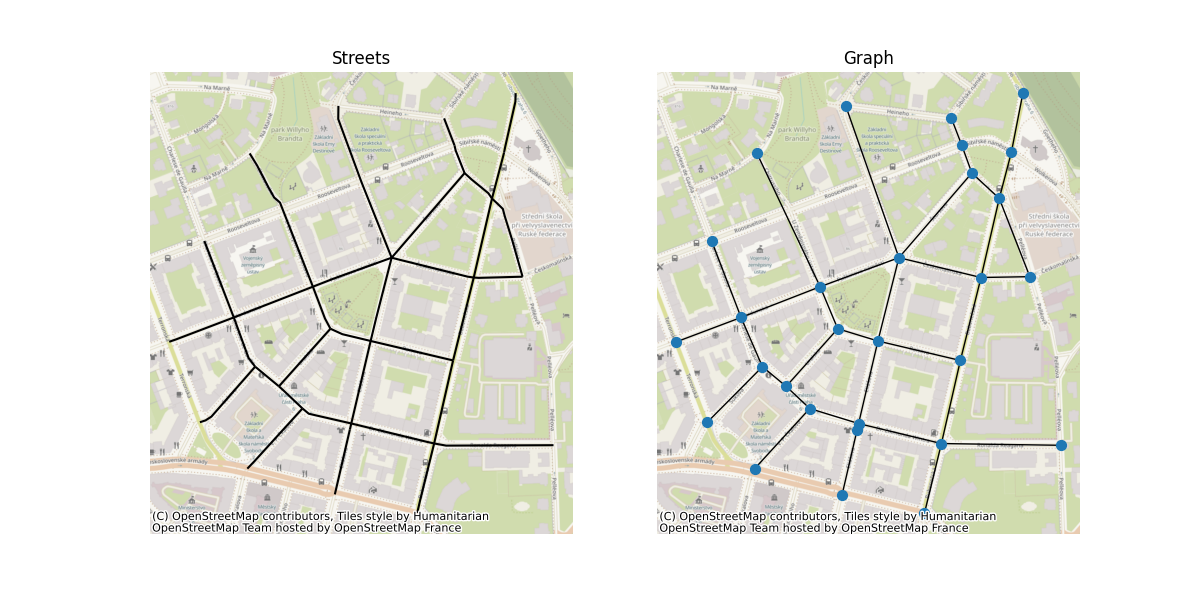
The first way is a so-called primal approach, where each intersection is a node and each linestring segment connecting two intersections is an edge.
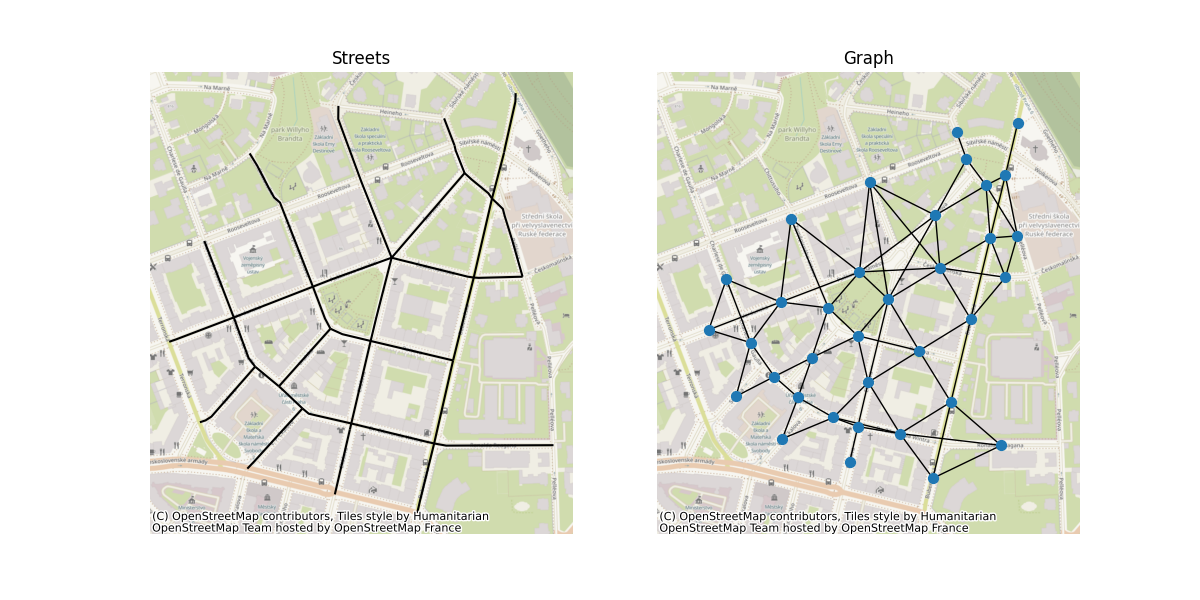
The second way is so-called dual approach, where each line is a node and intersection topology is turned into edges. One of the options how this is used for street network analysis is an angular analysis, where your routing is weighted via angles between street segments on intersections.
We will use GeoPandas to read spatial data and momepy to generate first primal graph and then dual graph. Furthermore, we will use PySAL to illustrate an alternative way of creating raw dual graph.
import geopandas
import matplotlib.pyplot as plt
import momepy
import networkx as nx
from contextily import add_basemap
from libpysal import weights
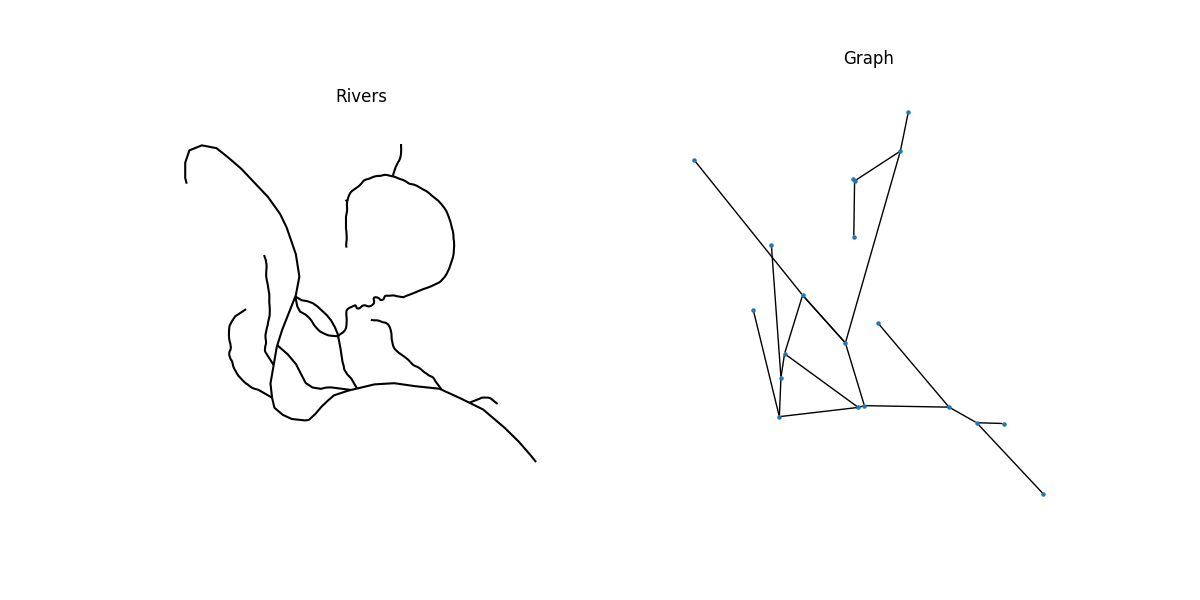
Read in example river geometry from GeoJSON. Source of example data: https://doi.org/10.3390/data5010008 (Nicolas Cadieux)
rivers = geopandas.read_file("rivers.geojson")
Construct the primal graph. momepy automatically preserves all attributes from GeoDataFrame and stores then as edge attributes.
G = momepy.gdf_to_nx(rivers, approach="primal")
Each node is encoded by its coordinates, which allows us to use them in plotting.
Once we finish graph-based analysis, we can convert graph back to GeoDataFrames. momepy can return nodes as point geometry, edges as original line geometry and W object, which is PySAL spatial weights matrix encoding original graph so we can use it with node GeoDataFrame.
nodes, edges, W = momepy.nx_to_gdf(G, spatial_weights=True)


# Read in example street network from GeoPackage
streets = geopandas.read_file(momepy.datasets.get_path("bubenec"), layer="streets")

# Construct the primal graph
G_primal = momepy.gdf_to_nx(streets, approach="primal")

# Plot
f, ax = plt.subplots(1, 2, figsize=(12, 6), sharex=True, sharey=True)
streets.plot(color="k", ax=ax[0])
for i, facet in enumerate(ax):
    facet.set_title(("Streets", "Graph")[i])
    facet.axis("off")
    try:  # For issues with downloading/parsing in CI
        add_basemap(facet)
    except:
        pass
nx.draw(
    G_primal, {n: [n[0], n[1]] for n in list(G_primal.nodes)}, ax=ax[1], node_size=50
)
Construct the dual graph. momepy will store row attributes as node attributes and automatically measures angle between lines.
G_dual = momepy.gdf_to_nx(streets, approach="dual")

# Plot
f, ax = plt.subplots(1, 2, figsize=(12, 6), sharex=True, sharey=True)
streets.plot(color="k", ax=ax[0])
for i, facet in enumerate(ax):
    facet.set_title(("Streets", "Graph")[i])
    facet.axis("off")
    try:  # For issues with downloading/parsing in CI
        add_basemap(facet)
    except:
        pass
nx.draw(G_dual, {n: [n[0], n[1]] for n in list(G_dual.nodes)}, ax=ax[1], node_size=50)
plt.show()

# Convert dual graph back to GeoDataFrame. Returns only original line geometry.
lines = momepy.nx_to_gdf(G_dual)
We can also construct the dual graph using PySAL. Note that it only encodes relationship between geometries and do not any store attributes. However, it is significantly faster than momepy.gdf_to_nx(). Create PySAL weights (graph).
W = weights.Queen.from_dataframe(streets)

# Convert the graph to networkx
G_dual = W.to_networkx()
Total running time of the script: (0 minutes 22.469 seconds)