
Note
Go to the end to download the full example code.
Hiveplotlib#
Hiveplotlib is a network visualization library for hive plots, a layout in which nodes are partitioned onto a small number of radial axes and positioned along each axis by a sorting variable. Since positions are determined by the data rather than a layout algorithm, hive plots are reproducible and make structural properties of a graph directly legible.
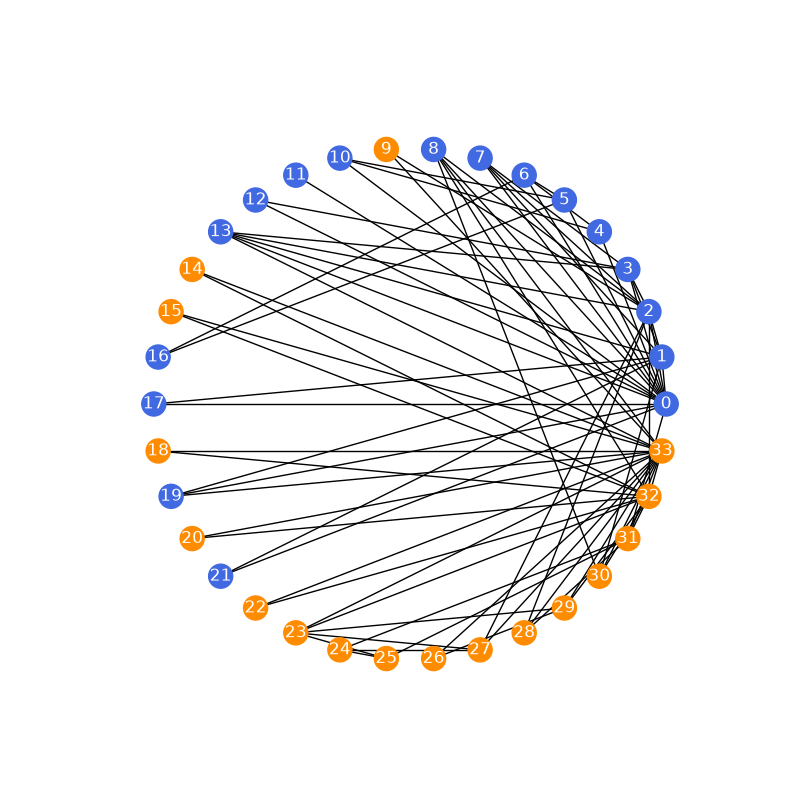
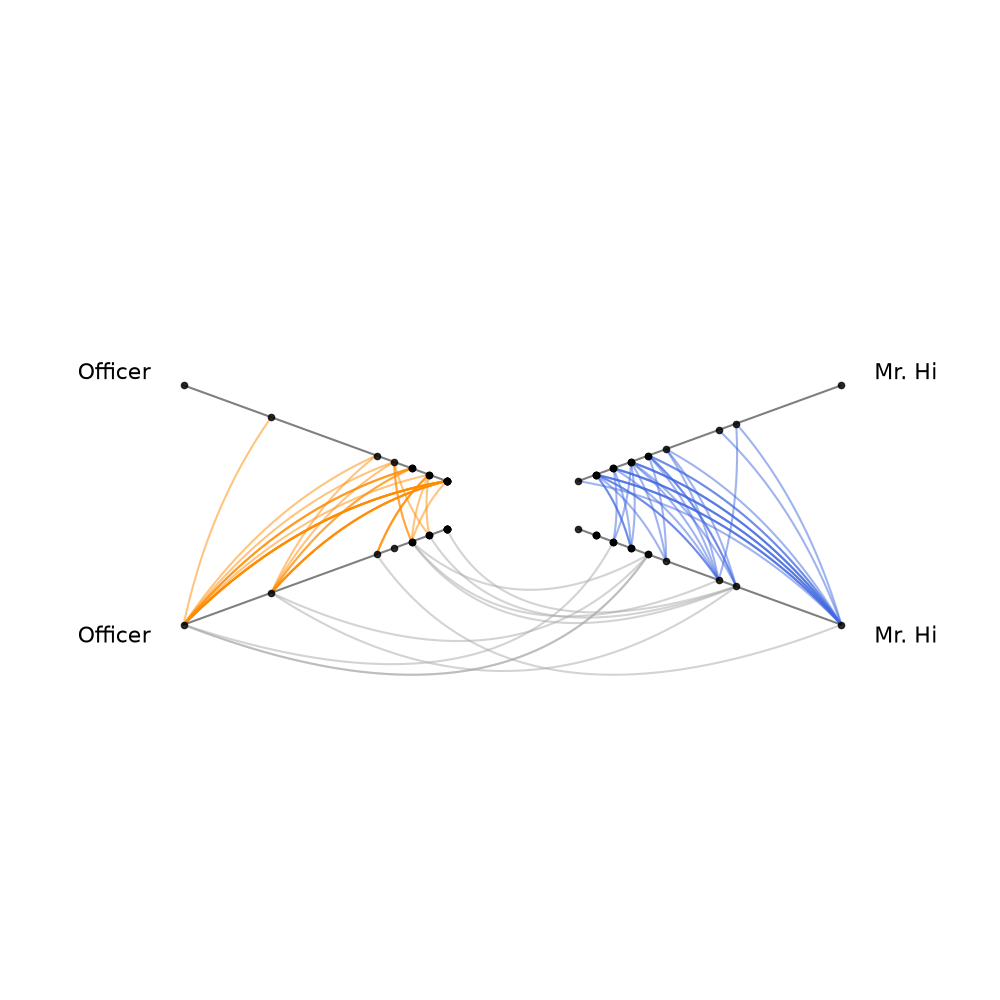
Below, we visualize Zachary’s Karate Club with both a conventional layout and a hive plot.
import matplotlib.pyplot as plt
import networkx as nx
from hiveplotlib import HivePlot

# sphinx_gallery_thumbnail_number = 2

G = nx.karate_club_graph()
Conventional View: Circular Layout#
Zachary’s Karate Club is usually drawn as a circular layout. That view shows every connection, but the relationship between the two factions is hard to read off the resulting alignment of edges.
# color nodes by faction
faction_color = [
    "royalblue" if data["club"] == "Mr. Hi" else "darkorange"
    for _, data in G.nodes(data=True)
]

fig, ax = plt.subplots(figsize=(8, 8))
nx.draw_circular(
    G, with_labels=True, node_color=faction_color, font_color="white", ax=ax
)
plt.show()
Hive Plot View#
We pass the NetworkX graph directly to the HivePlot class, partitioning nodes
onto axes by their club membership and sorting each axis by node degree
(requesting degree as a computed metric at construction time).
Using repeat axes lets us see within-faction edges, while coloring distinguishes within-faction connections (blue/orange) from between-faction ones (gray).
hp = HivePlot(
    graph=G,
    partition_variable="club",
    sorting_variables="degree",
    node_graph_metrics="degree",
    repeat_axes=True,
    non_repeat_edge_kwargs={"color": "darkgray"},
)
hp.update_edges("Mr. Hi", "Mr. Hi", color="royalblue")
hp.update_edges("Officer", "Officer", color="darkorange")

# only two partition groups, so drop one of the two redundant sets of
# between-faction edges
hp.reset_edges(axis_id_1="Mr. Hi_repeat", axis_id_2="Officer")

fig, ax = hp.plot()
plt.show()
Total running time of the script: (0 minutes 0.147 seconds)