
Note
Go to the end to download the full example code.
Atlas#
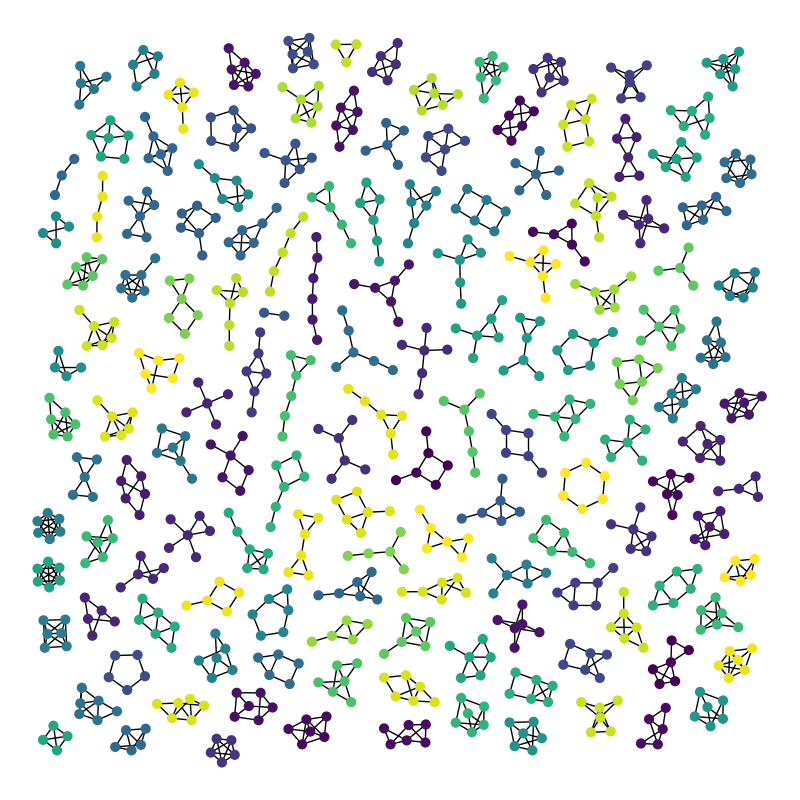
Atlas of all connected graphs with up to 6 nodes.
This example uses Graphviz via PyGraphviz.
The image should show 142 graphs. We don’t plot the empty graph nor the single node graph. (142 is the sum of values 2 to n=6 in sequence oeis.org/A001349).
Graph named 'G208' with 809 nodes and 1112 edges
142 connected components
import random

import matplotlib.pyplot as plt
import networkx as nx


GraphMatcher = nx.isomorphism.vf2userfunc.GraphMatcher


def atlas6():
    """Return the atlas of all connected graphs with at most 6 nodes"""

    Atlas = nx.graph_atlas_g()[3:209]  # 0, 1, 2 => no edges. 208 is last 6 node graph
    U = nx.Graph()  # graph for union of all graphs in atlas
    for G in Atlas:
        # check if connected
        if nx.number_connected_components(G) == 1:
            # check if isomorphic to a previous graph
            if not GraphMatcher(U, G).subgraph_is_isomorphic():
                U = nx.disjoint_union(U, G)
    return U


G = atlas6()

print(G)
print(nx.number_connected_components(G), "connected components")

plt.figure(1, figsize=(8, 8))
# layout graphs with positions using graphviz neato
pos = nx.nx_agraph.graphviz_layout(G, prog="neato")
# color nodes the same in each connected subgraph
C = (G.subgraph(c) for c in nx.connected_components(G))
for g in C:
    c = [random.random()] * nx.number_of_nodes(g)  # random color...
    nx.draw(g, pos, node_size=40, node_color=c, vmin=0.0, vmax=1.0, with_labels=False)
plt.show()
Total running time of the script: (0 minutes 2.949 seconds)