
Note
Go to the end to download the full example code.
Lanl Routes#
Routes to LANL from 186 sites on the Internet.
The data file can be found at:
This example needs Graphviz and PyGraphviz.
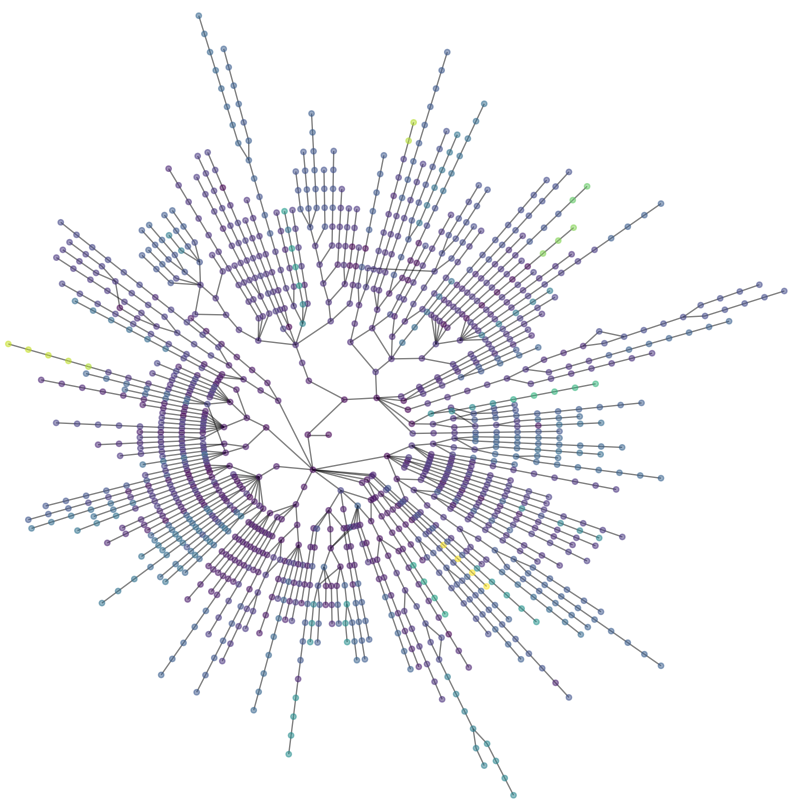
Graph with 1281 nodes and 1296 edges
1 connected components
import matplotlib.pyplot as plt
import networkx as nx


def lanl_graph():
    """Return the lanl internet view graph from lanl.edges"""
    try:
        fh = open("lanl_routes.edgelist")
    except OSError:
        print("lanl.edges not found")
        raise

    G = nx.Graph()

    time = {}
    time[0] = 0  # assign 0 to center node
    for line in fh.readlines():
        (head, tail, rtt) = line.split()
        G.add_edge(int(head), int(tail))
        time[int(head)] = float(rtt)

    # get largest component and assign ping times to G0time dictionary
    Gcc = sorted(nx.connected_components(G), key=len, reverse=True)[0]
    G0 = G.subgraph(Gcc)
    G0.rtt = {}
    for n in G0:
        G0.rtt[n] = time[n]

    return G0


G = lanl_graph()

print(G)
print(nx.number_connected_components(G), "connected components")

plt.figure(figsize=(8, 8))
# use graphviz to find radial layout
pos = nx.nx_agraph.graphviz_layout(G, prog="twopi", root=0)
# draw nodes, coloring by rtt ping time
options = {"with_labels": False, "alpha": 0.5, "node_size": 15}
nx.draw(G, pos, node_color=[G.rtt[v] for v in G], **options)
# adjust the plot limits
xmax = 1.02 * max(xx for xx, yy in pos.values())
ymax = 1.02 * max(yy for xx, yy in pos.values())
plt.xlim(0, xmax)
plt.ylim(0, ymax)
plt.show()
Total running time of the script: (0 minutes 0.262 seconds)