Note
Go to the end to download the full example code.
igraph#
igraph (https://igraph.org/) is a popular network analysis package that provides (among many other things) functions to convert to/from NetworkX.
import matplotlib.pyplot as plt
import networkx as nx
import igraph as ig
NetworkX to igraph#
G = nx.dense_gnm_random_graph(30, 40, seed=42)

# largest connected component
components = nx.connected_components(G)
largest_component = max(components, key=len)
H = G.subgraph(largest_component)

# convert to igraph
h = ig.Graph.from_networkx(H)


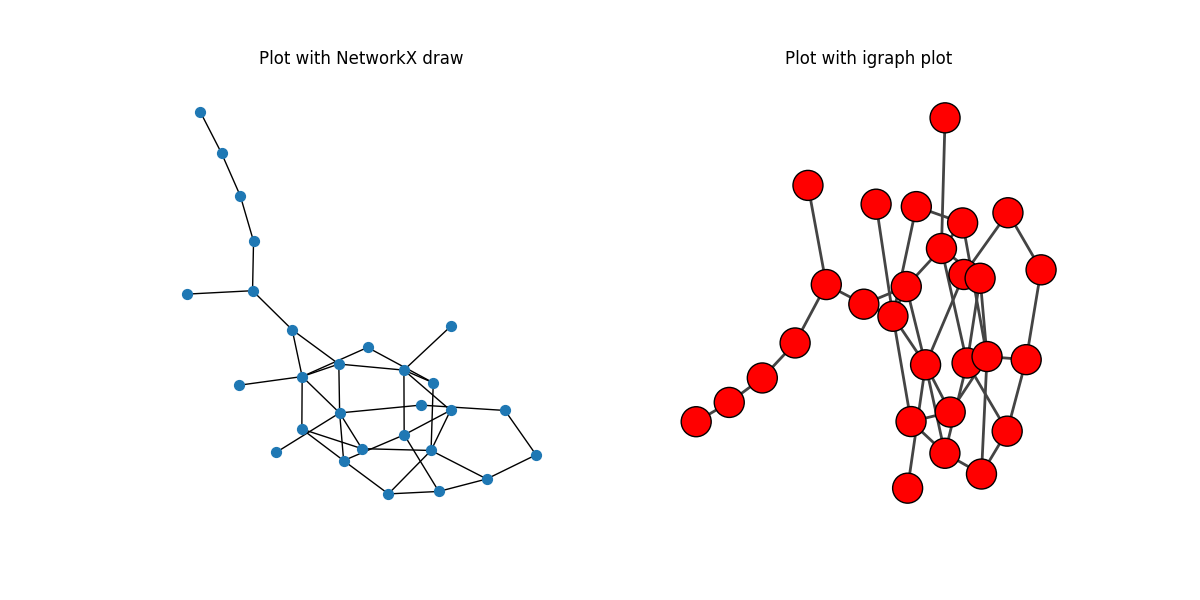
# Plot the same network with NetworkX and igraph
fig, (ax0, ax1) = plt.subplots(nrows=1, ncols=2, figsize=(12, 6))

# NetworkX draw
ax0.set_title("Plot with NetworkX draw")
nx.draw_kamada_kawai(H, node_size=50, ax=ax0)

# igraph draw
ax1.set_title("Plot with igraph plot")
layout = h.layout_kamada_kawai()
ig.plot(h, layout=layout, target=ax1)
plt.axis("off")
plt.show()

igraph to NetworkX#
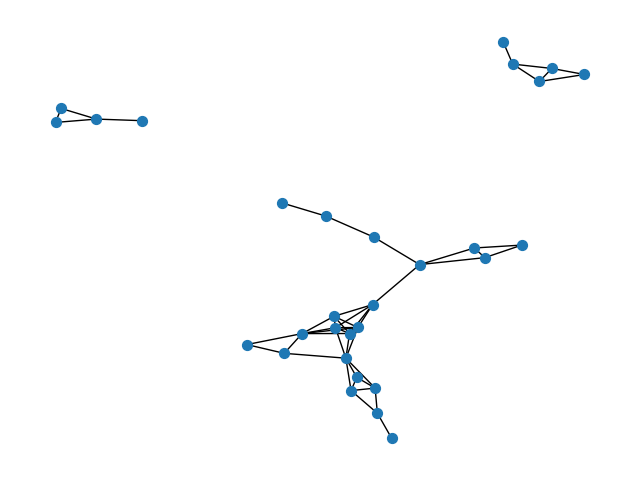
g = ig.Graph.GRG(30, 0.2)
G = g.to_networkx()
nx.draw(G, node_size=50)
plt.show()

Total running time of the script: (0 minutes 0.776 seconds)