
Note
Go to the end to download the full example code.
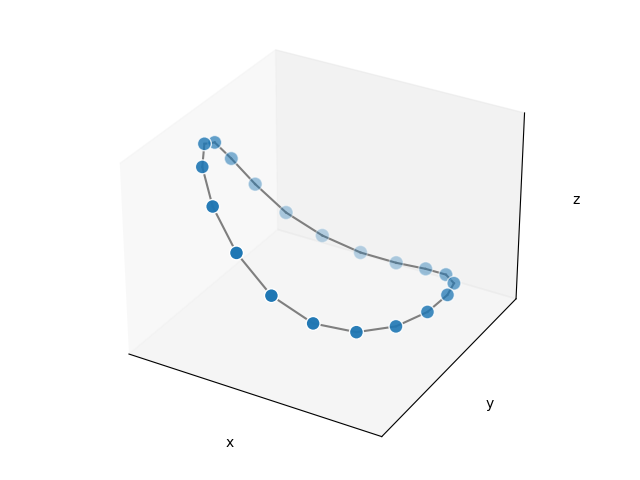
Basic matplotlib#
A basic example of 3D Graph visualization using mpl_toolkits.mplot_3d.
import networkx as nx
import numpy as np
import matplotlib.pyplot as plt
from mpl_toolkits.mplot3d import Axes3D

# The graph to visualize
G = nx.cycle_graph(20)

# 3d spring layout
pos = nx.spring_layout(G, dim=3, seed=779)
# Extract node and edge positions from the layout
node_xyz = np.array([pos[v] for v in sorted(G)])
edge_xyz = np.array([(pos[u], pos[v]) for u, v in G.edges()])

# Create the 3D figure
fig = plt.figure()
ax = fig.add_subplot(111, projection="3d")

# Plot the nodes - alpha is scaled by "depth" automatically
ax.scatter(*node_xyz.T, s=100, ec="w")

# Plot the edges
for vizedge in edge_xyz:
    ax.plot(*vizedge.T, color="tab:gray")


def _format_axes(ax):
    """Visualization options for the 3D axes."""
    # Turn gridlines off
    ax.grid(False)
    # Suppress tick labels
    for dim in (ax.xaxis, ax.yaxis, ax.zaxis):
        dim.set_ticks([])
    # Set axes labels
    ax.set_xlabel("x")
    ax.set_ylabel("y")
    ax.set_zlabel("z")


_format_axes(ax)
fig.tight_layout()
plt.show()
Total running time of the script: (0 minutes 0.082 seconds)