Note
Click here to download the full example code
OpenStreetMap with OSMnx
This example shows how to use OSMnx to download and model a street network from OpenStreetMap, visualize centrality, and save the graph as a shapefile, a GeoPackage, or GraphML.
OSMnx is a Python package to retrieve, model, analyze, and visualize OpenStreetMap street networks as NetworkX MultiDiGraph objects. It can also retrieve any other spatial data from OSM as geopandas GeoDataFrames. See https://osmnx.readthedocs.io/ for OSMnx documentation and usage.
import networkx as nx
import osmnx as ox
ox.config(use_cache=True, log_console=True)
# download street network data from OSM and construct a MultiDiGraph model
G = ox.graph_from_point((37.79, -122.41), dist=750, network_type="drive")
# impute edge (driving) speeds and calculate edge traversal times
G = ox.add_edge_speeds(G)
G = ox.add_edge_travel_times(G)
# you can convert MultiDiGraph to/from geopandas GeoDataFrames
gdf_nodes, gdf_edges = ox.graph_to_gdfs(G)
G = ox.graph_from_gdfs(gdf_nodes, gdf_edges, graph_attrs=G.graph)
# convert MultiDiGraph to DiGraph to use nx.betweenness_centrality function
# choose between parallel edges by minimizing travel_time attribute value
D = ox.utils_graph.get_digraph(G, weight="travel_time")
# calculate node betweenness centrality, weighted by travel time
bc = nx.betweenness_centrality(D, weight="travel_time", normalized=True)
nx.set_node_attributes(G, values=bc, name="bc")
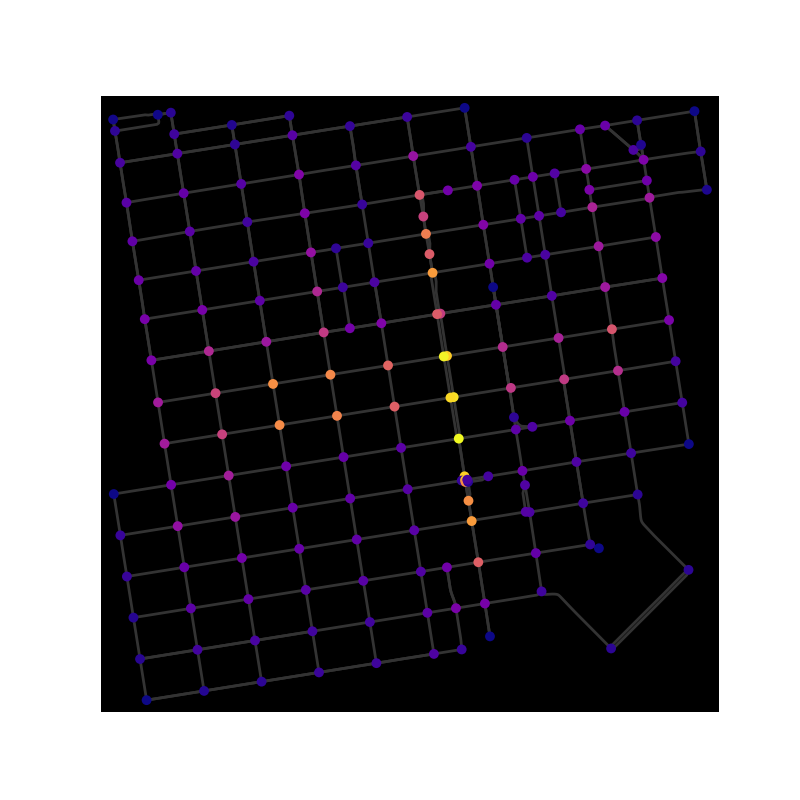
# plot the graph, coloring nodes by betweenness centrality
nc = ox.plot.get_node_colors_by_attr(G, "bc", cmap="plasma")
fig, ax = ox.plot_graph(
G, bgcolor="k", node_color=nc, node_size=50, edge_linewidth=2, edge_color="#333333"
)
# save graph to shapefile, geopackage, or graphml
ox.save_graph_shapefile(G, filepath="./graph_shapefile/")
ox.save_graph_geopackage(G, filepath="./graph.gpkg")
ox.save_graphml(G, filepath="./graph.graphml")
Total running time of the script: ( 0 minutes 7.772 seconds)