
Note
Go to the end to download the full example code.
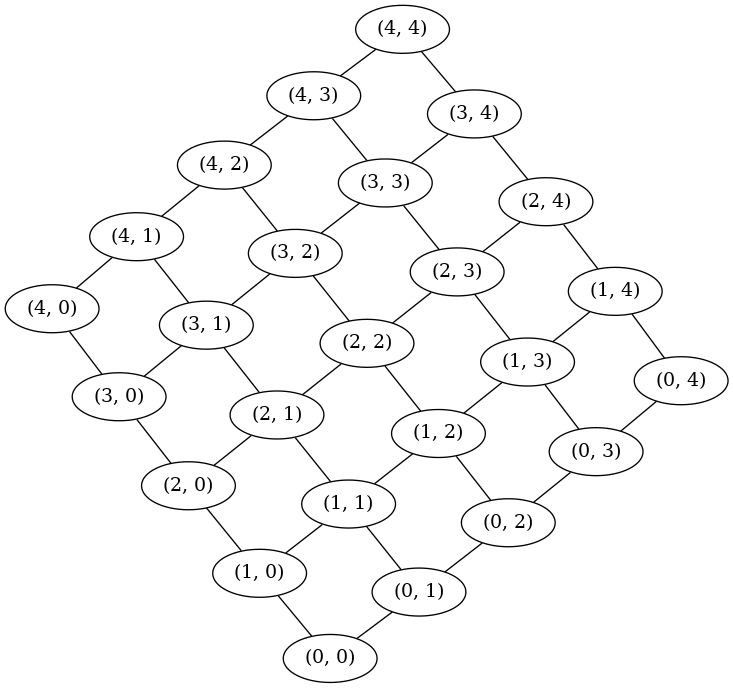
2D Grid#
Illustrate write_dot in conjunction with the
Graphviz command line interface to create visualizations.
import matplotlib.pyplot as plt
import networkx as nx
Write a dot file from a networkx graph for further processing with graphviz.
G = nx.grid_2d_graph(5, 5)  # 5x5 grid
# This example needs Graphviz and PyGraphviz
nx.nx_agraph.write_dot(G, "grid.dot")
# Having created the dot file, graphviz can be invoked via the command line
# to generate an image on disk, e.g.
print("Now run: neato -Tps grid.dot >grid.ps")

# Alternatively, the and image can be created directly via AGraph.draw
A = nx.nx_agraph.to_agraph(G)
A.draw("5x5.png", prog="neato")
Now run: neato -Tps grid.dot >grid.ps
Total running time of the script: (0 minutes 0.055 seconds)