Warning
This documents an unmaintained version of NetworkX. Please upgrade to a maintained version and see the current NetworkX documentation.
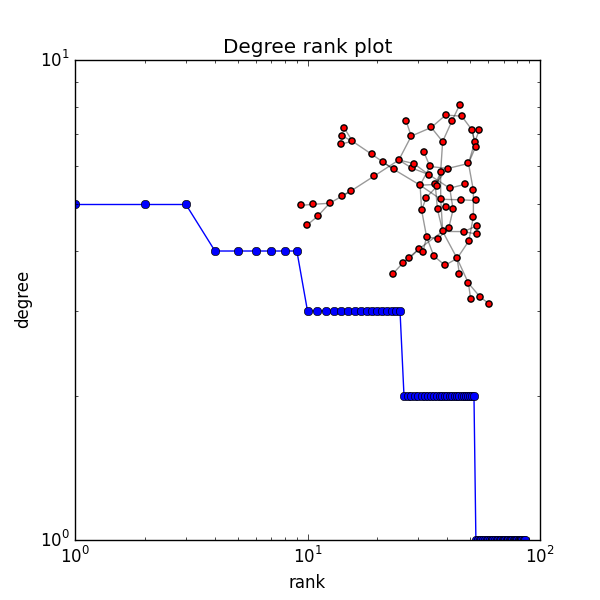
Degree Histogram
#!/usr/bin/env python
"""
Random graph from given degree sequence.
Draw degree rank plot and graph with matplotlib.
"""
__author__ = """Aric Hagberg <aric.hagberg@gmail.com>"""
import networkx as nx
import matplotlib.pyplot as plt
G = nx.gnp_random_graph(100,0.02)

degree_sequence=sorted(nx.degree(G).values(),reverse=True) # degree sequence
#print "Degree sequence", degree_sequence
dmax=max(degree_sequence)

plt.loglog(degree_sequence,'b-',marker='o')
plt.title("Degree rank plot")
plt.ylabel("degree")
plt.xlabel("rank")

# draw graph in inset
plt.axes([0.45,0.45,0.45,0.45])
Gcc=sorted(nx.connected_component_subgraphs(G), key = len, reverse=True)[0]
pos=nx.spring_layout(Gcc)
plt.axis('off')
nx.draw_networkx_nodes(Gcc,pos,node_size=20)
nx.draw_networkx_edges(Gcc,pos,alpha=0.4)

plt.savefig("degree_histogram.png")
plt.show()