Note
Go to the end to download the full example code.
Self-loops#
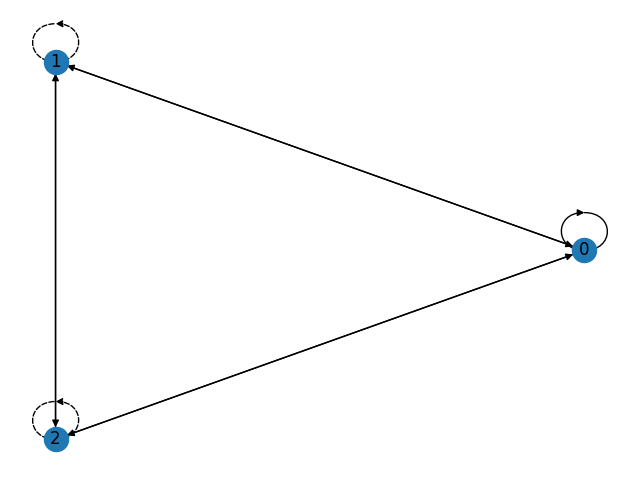
A self-loop is an edge that originates from and terminates the same node.
This example shows how to draw self-loops with nx_pylab.

import networkx as nx
import matplotlib.pyplot as plt

# Create a graph and add a self-loop to node 0
G = nx.complete_graph(3, create_using=nx.DiGraph)
G.add_edge(0, 0)
pos = nx.circular_layout(G)

# As of version 2.6, self-loops are drawn by default with the same styling as
# other edges
nx.draw(G, pos, with_labels=True)

# Add self-loops to the remaining nodes
edgelist = [(1, 1), (2, 2)]
G.add_edges_from(edgelist)

# Draw the newly added self-loops with different formatting
nx.draw_networkx_edges(G, pos, edgelist=edgelist, arrowstyle="<|-", style="dashed")

plt.show()
Total running time of the script: (0 minutes 0.076 seconds)