Note
Click here to download the full example code
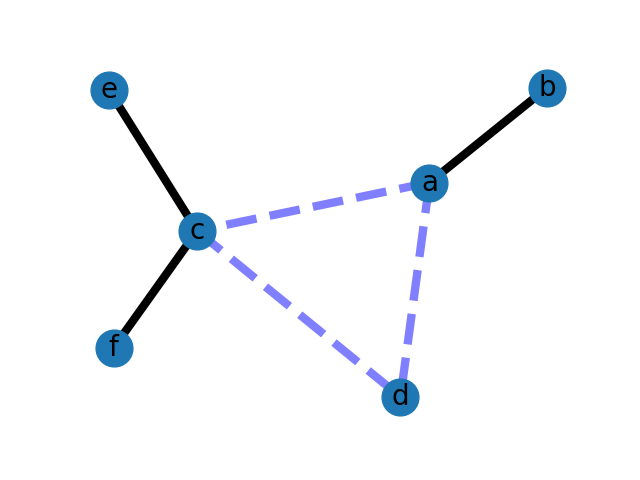
Weighted Graph
An example using Graph as a weighted network.
# Author: Aric Hagberg (hagberg@lanl.gov)
import matplotlib.pyplot as plt
import networkx as nx

G = nx.Graph()

G.add_edge('a', 'b', weight=0.6)
G.add_edge('a', 'c', weight=0.2)
G.add_edge('c', 'd', weight=0.1)
G.add_edge('c', 'e', weight=0.7)
G.add_edge('c', 'f', weight=0.9)
G.add_edge('a', 'd', weight=0.3)

elarge = [(u, v) for (u, v, d) in G.edges(data=True) if d['weight'] > 0.5]
esmall = [(u, v) for (u, v, d) in G.edges(data=True) if d['weight'] <= 0.5]

pos = nx.spring_layout(G)  # positions for all nodes

# nodes
nx.draw_networkx_nodes(G, pos, node_size=700)

# edges
nx.draw_networkx_edges(G, pos, edgelist=elarge,
                       width=6)
nx.draw_networkx_edges(G, pos, edgelist=esmall,
                       width=6, alpha=0.5, edge_color='b', style='dashed')

# labels
nx.draw_networkx_labels(G, pos, font_size=20, font_family='sans-serif')

plt.axis('off')
plt.show()
Total running time of the script: ( 0 minutes 0.184 seconds)