Note
Click here to download the full example code
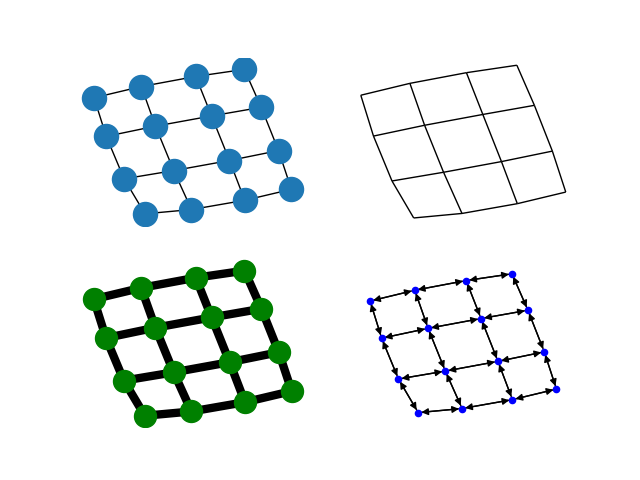
Four Grids
Draw a graph with matplotlib. You must have matplotlib for this to work.
# Author: Aric Hagberg (hagberg@lanl.gov)

#    Copyright (C) 2004-2019
#    Aric Hagberg <hagberg@lanl.gov>
#    Dan Schult <dschult@colgate.edu>
#    Pieter Swart <swart@lanl.gov>
#    All rights reserved.
#    BSD license.

import matplotlib.pyplot as plt
import networkx as nx

G = nx.grid_2d_graph(4, 4)  # 4x4 grid

pos = nx.spring_layout(G, iterations=100)

plt.subplot(221)
nx.draw(G, pos, font_size=8)

plt.subplot(222)
nx.draw(G, pos, node_color='k', node_size=0, with_labels=False)

plt.subplot(223)
nx.draw(G, pos, node_color='g', node_size=250, with_labels=False, width=6)

plt.subplot(224)
H = G.to_directed()
nx.draw(H, pos, node_color='b', node_size=20, with_labels=False)

plt.show()
Total running time of the script: ( 0 minutes 0.405 seconds)