Note
Click here to download the full example code
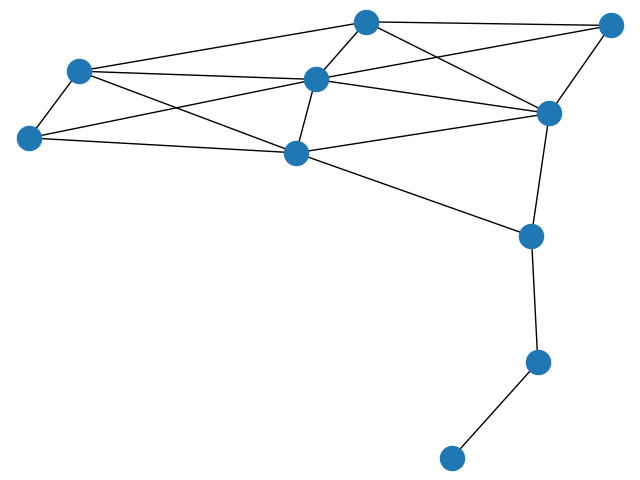
Krackhardt Centrality
Centrality measures of Krackhardt social network.

Out:
Betweenness
 0 0.023
 1 0.023
 2 0.000
 3 0.102
 4 0.000
 5 0.231
 6 0.231
 7 0.389
 8 0.222
 9 0.000
Degree centrality
 0 0.444
 1 0.444
 2 0.333
 3 0.667
 4 0.333
 5 0.556
 6 0.556
 7 0.333
 8 0.222
 9 0.111
Closeness centrality
 0 0.529
 1 0.529
 2 0.500
 3 0.600
 4 0.500
 5 0.643
 6 0.643
 7 0.600
 8 0.429
 9 0.310
import matplotlib.pyplot as plt
import networkx as nx

G = nx.krackhardt_kite_graph()

print("Betweenness")
b = nx.betweenness_centrality(G)
for v in G.nodes():
    print(f"{v:2} {b[v]:.3f}")

print("Degree centrality")
d = nx.degree_centrality(G)
for v in G.nodes():
    print(f"{v:2} {d[v]:.3f}")

print("Closeness centrality")
c = nx.closeness_centrality(G)
for v in G.nodes():
    print(f"{v:2} {c[v]:.3f}")

nx.draw(G)
plt.show()
Total running time of the script: ( 0 minutes 0.123 seconds)