Note
Click here to download the full example code
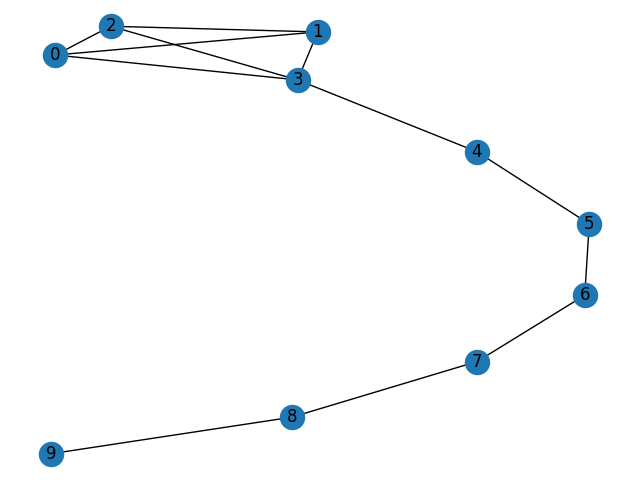
Properties
Compute some network properties for the lollipop graph.
Out:
source vertex {target:length, }
0 {0: 0, 1: 1, 2: 1, 3: 1, 4: 2, 5: 3, 6: 4, 7: 5, 8: 6, 9: 7}
1 {1: 0, 0: 1, 2: 1, 3: 1, 4: 2, 5: 3, 6: 4, 7: 5, 8: 6, 9: 7}
2 {2: 0, 0: 1, 1: 1, 3: 1, 4: 2, 5: 3, 6: 4, 7: 5, 8: 6, 9: 7}
3 {3: 0, 0: 1, 1: 1, 2: 1, 4: 1, 5: 2, 6: 3, 7: 4, 8: 5, 9: 6}
4 {4: 0, 5: 1, 3: 1, 6: 2, 0: 2, 1: 2, 2: 2, 7: 3, 8: 4, 9: 5}
5 {5: 0, 4: 1, 6: 1, 3: 2, 7: 2, 0: 3, 1: 3, 2: 3, 8: 3, 9: 4}
6 {6: 0, 5: 1, 7: 1, 4: 2, 8: 2, 3: 3, 9: 3, 0: 4, 1: 4, 2: 4}
7 {7: 0, 6: 1, 8: 1, 5: 2, 9: 2, 4: 3, 3: 4, 0: 5, 1: 5, 2: 5}
8 {8: 0, 7: 1, 9: 1, 6: 2, 5: 3, 4: 4, 3: 5, 0: 6, 1: 6, 2: 6}
9 {9: 0, 8: 1, 7: 2, 6: 3, 5: 4, 4: 5, 3: 6, 0: 7, 1: 7, 2: 7}

average shortest path length 2.86

length #paths
0 10
1 24
2 16
3 14
4 12
5 10
6 8
7 6
radius: 4
diameter: 7
eccentricity: {0: 7, 1: 7, 2: 7, 3: 6, 4: 5, 5: 4, 6: 4, 7: 5, 8: 6, 9: 7}
center: [5, 6]
periphery: [0, 1, 2, 9]
density: 0.26666666666666666
#    Copyright (C) 2004-2019 by
#    Aric Hagberg <hagberg@lanl.gov>
#    Dan Schult <dschult@colgate.edu>
#    Pieter Swart <swart@lanl.gov>
#    All rights reserved.
#    BSD license.

import matplotlib.pyplot as plt
from networkx import nx

G = nx.lollipop_graph(4, 6)

pathlengths = []

print("source vertex {target:length, }")
for v in G.nodes():
    spl = dict(nx.single_source_shortest_path_length(G, v))
    print('{} {} '.format(v, spl))
    for p in spl:
        pathlengths.append(spl[p])

print('')
print("average shortest path length %s" % (sum(pathlengths) / len(pathlengths)))

# histogram of path lengths
dist = {}
for p in pathlengths:
    if p in dist:
        dist[p] += 1
    else:
        dist[p] = 1

print('')
print("length #paths")
verts = dist.keys()
for d in sorted(verts):
    print('%s %d' % (d, dist[d]))

print("radius: %d" % nx.radius(G))
print("diameter: %d" % nx.diameter(G))
print("eccentricity: %s" % nx.eccentricity(G))
print("center: %s" % nx.center(G))
print("periphery: %s" % nx.periphery(G))
print("density: %s" % nx.density(G))

nx.draw(G, with_labels=True)
plt.show()
Total running time of the script: ( 0 minutes 0.187 seconds)