Note
Click here to download the full example code
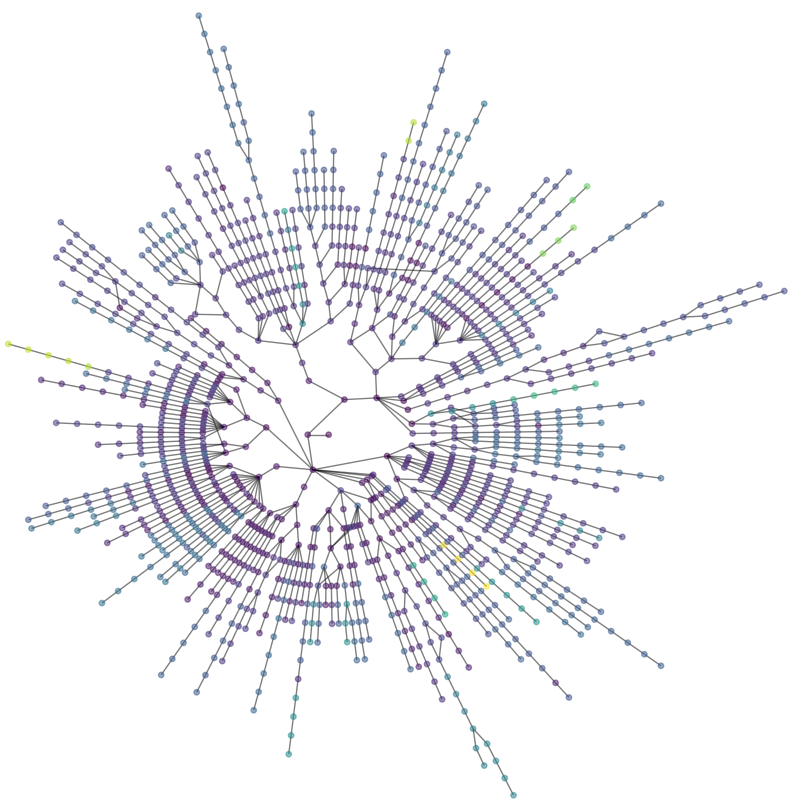
Lanl Routes
Routes to LANL from 186 sites on the Internet.
This uses Graphviz for layout so you need PyGraphviz or pydot.
Out:
graph has 1281 nodes with 1296 edges
1 connected components
# Author: Aric Hagberg (hagberg@lanl.gov)

#    Copyright (C) 2004-2019
#    Aric Hagberg <hagberg@lanl.gov>
#    Dan Schult <dschult@colgate.edu>
#    Pieter Swart <swart@lanl.gov>
#    All rights reserved.
#    BSD license.


import matplotlib.pyplot as plt
import networkx as nx
try:
    import pygraphviz
    from networkx.drawing.nx_agraph import graphviz_layout
except ImportError:
    try:
        import pydot
        from networkx.drawing.nx_pydot import graphviz_layout
    except ImportError:
        raise ImportError("This example needs Graphviz and either "
                          "PyGraphviz or pydot")

def lanl_graph():
    """ Return the lanl internet view graph from lanl.edges
    """
    try:
        fh = open('lanl_routes.edgelist', 'r')
    except IOError:
        print("lanl.edges not found")
        raise

    G = nx.Graph()

    time = {}
    time[0] = 0  # assign 0 to center node
    for line in fh.readlines():
        (head, tail, rtt) = line.split()
        G.add_edge(int(head), int(tail))
        time[int(head)] = float(rtt)

    # get largest component and assign ping times to G0time dictionary
    G0 = sorted(nx.connected_component_subgraphs(G), key=len, reverse=True)[0]
    G0.rtt = {}
    for n in G0:
        G0.rtt[n] = time[n]

    return G0


if __name__ == '__main__':

    G = lanl_graph()

    print("graph has %d nodes with %d edges"
          % (nx.number_of_nodes(G), nx.number_of_edges(G)))
    print(nx.number_connected_components(G), "connected components")

    plt.figure(figsize=(8, 8))
    # use graphviz to find radial layout
    pos = graphviz_layout(G, prog="twopi", root=0)
    # draw nodes, coloring by rtt ping time
    nx.draw(G, pos,
            node_color=[G.rtt[v] for v in G],
            with_labels=False,
            alpha=0.5,
            node_size=15)
    # adjust the plot limits
    xmax = 1.02 * max(xx for xx, yy in pos.values())
    ymax = 1.02 * max(yy for xx, yy in pos.values())
    plt.xlim(0, xmax)
    plt.ylim(0, ymax)
    plt.show()
Total running time of the script: ( 0 minutes 0.481 seconds)