Note
Click here to download the full example code
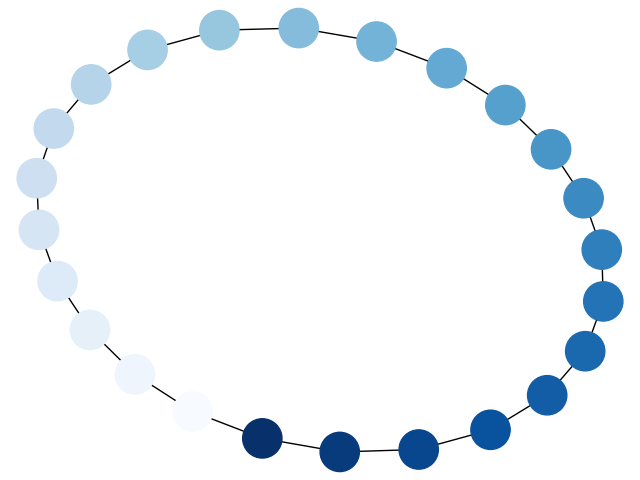
Node Colormap
Draw a graph with matplotlib, color by degree. You must have matplotlib for this to work.
# Author: Aric Hagberg (hagberg@lanl.gov)

import matplotlib.pyplot as plt
import networkx as nx

G = nx.cycle_graph(24)
pos = nx.spring_layout(G, iterations=200)
nx.draw(G, pos, node_color=range(24), node_size=800, cmap=plt.cm.Blues)
plt.show()
Total running time of the script: ( 0 minutes 0.117 seconds)