Note
Click here to download the full example code
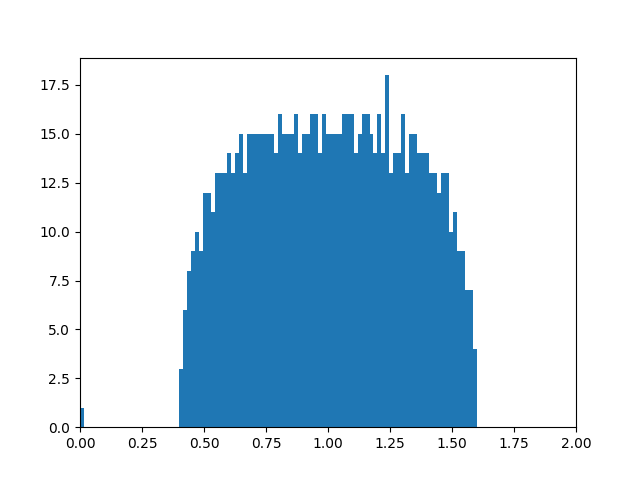
Eigenvalues
Create an G{n,m} random graph and compute the eigenvalues.
Out:
('Largest eigenvalue:', 1.5991223317120151)
('Smallest eigenvalue:', 2.831983026219472e-16)
import matplotlib.pyplot as plt
import networkx as nx
import numpy.linalg

n = 1000  # 1000 nodes
m = 5000  # 5000 edges
G = nx.gnm_random_graph(n, m)

L = nx.normalized_laplacian_matrix(G)
e = numpy.linalg.eigvals(L.A)
print("Largest eigenvalue:", max(e))
print("Smallest eigenvalue:", min(e))
plt.hist(e, bins=100)  # histogram with 100 bins
plt.xlim(0, 2)  # eigenvalues between 0 and 2
plt.show()
Total running time of the script: ( 0 minutes 9.249 seconds)