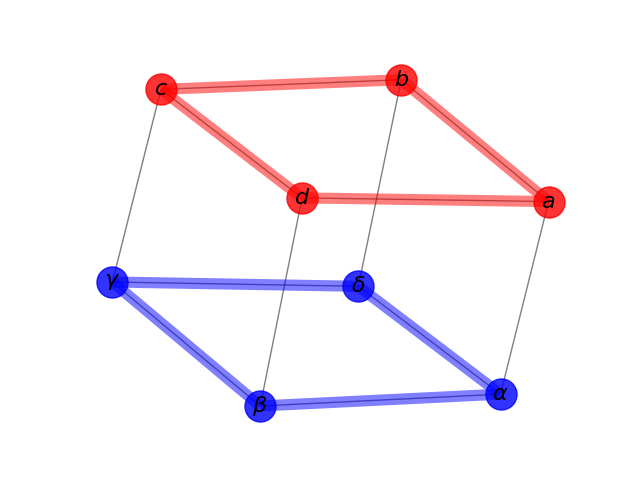
Labels And Colors
Draw a graph with matplotlib, color by degree.
You must have matplotlib for this to work.
# Author: Aric Hagberg (hagberg@lanl.gov)
import matplotlib.pyplot as plt
import networkx as nx

G = nx.cubical_graph()
pos = nx.spring_layout(G)  # positions for all nodes

# nodes
nx.draw_networkx_nodes(G, pos,
                       nodelist=[0, 1, 2, 3],
                       node_color='r',
                       node_size=500,
                       alpha=0.8)
nx.draw_networkx_nodes(G, pos,
                       nodelist=[4, 5, 6, 7],
                       node_color='b',
                       node_size=500,
                       alpha=0.8)

# edges
nx.draw_networkx_edges(G, pos, width=1.0, alpha=0.5)
nx.draw_networkx_edges(G, pos,
                       edgelist=[(0, 1), (1, 2), (2, 3), (3, 0)],
                       width=8, alpha=0.5, edge_color='r')
nx.draw_networkx_edges(G, pos,
                       edgelist=[(4, 5), (5, 6), (6, 7), (7, 4)],
                       width=8, alpha=0.5, edge_color='b')


# some math labels
labels = {}
labels[0] = r'$a$'
labels[1] = r'$b$'
labels[2] = r'$c$'
labels[3] = r'$d$'
labels[4] = r'$\alpha$'
labels[5] = r'$\beta$'
labels[6] = r'$\gamma$'
labels[7] = r'$\delta$'
nx.draw_networkx_labels(G, pos, labels, font_size=16)

plt.axis('off')
plt.show()
Total running time of the script: ( 0 minutes 0.067 seconds)