Warning
This documents an unmaintained version of NetworkX. Please upgrade to a maintained version and see the current NetworkX documentation.
Labels And Colors

#!/usr/bin/env python
"""
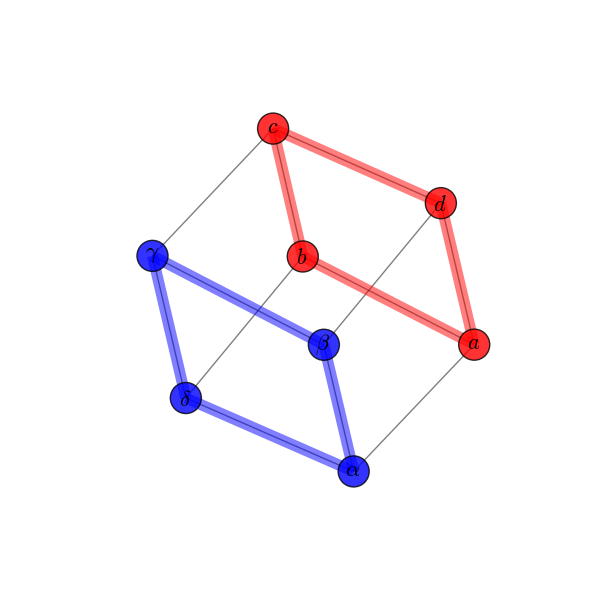
Draw a graph with matplotlib, color by degree.

You must have matplotlib for this to work.
"""
__author__ = """Aric Hagberg (hagberg@lanl.gov)"""
import matplotlib.pyplot as plt

import networkx as nx

G=nx.cubical_graph()
pos=nx.spring_layout(G) # positions for all nodes

# nodes
nx.draw_networkx_nodes(G,pos,
                       nodelist=[0,1,2,3],
                       node_color='r',
                       node_size=500,
                   alpha=0.8)
nx.draw_networkx_nodes(G,pos,
                       nodelist=[4,5,6,7],
                       node_color='b',
                       node_size=500,
                   alpha=0.8)

# edges
nx.draw_networkx_edges(G,pos,width=1.0,alpha=0.5)
nx.draw_networkx_edges(G,pos,
                       edgelist=[(0,1),(1,2),(2,3),(3,0)],
                       width=8,alpha=0.5,edge_color='r')
nx.draw_networkx_edges(G,pos,
                       edgelist=[(4,5),(5,6),(6,7),(7,4)],
                       width=8,alpha=0.5,edge_color='b')


# some math labels
labels={}
labels[0]=r'$a$'
labels[1]=r'$b$'
labels[2]=r'$c$'
labels[3]=r'$d$'
labels[4]=r'$\alpha$'
labels[5]=r'$\beta$'
labels[6]=r'$\gamma$'
labels[7]=r'$\delta$'
nx.draw_networkx_labels(G,pos,labels,font_size=16)

plt.axis('off')
plt.savefig("labels_and_colors.png") # save as png
plt.show() # display