#!/usr/bin/env python
# -*- coding: utf-8 -*-
"""
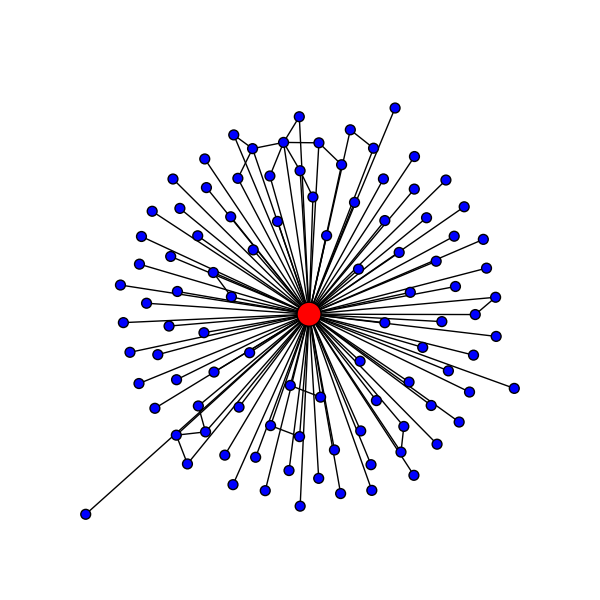
Example using the NetworkX ego_graph() function to return the main egonet of
the largest hub in a Barabási-Albert network.
"""
__author__="""Drew Conway (drew.conway@nyu.edu)"""

from operator import itemgetter
import networkx as nx
import matplotlib.pyplot as plt


if __name__ == '__main__':
    # Create a BA model graph
    n=1000
    m=2
    G=nx.generators.barabasi_albert_graph(n,m)
    # find node with largest degree
    node_and_degree=G.degree()
    (largest_hub,degree)=sorted(node_and_degree.items(),key=itemgetter(1))[-1]
    # Create ego graph of main hub
    hub_ego=nx.ego_graph(G,largest_hub)
    # Draw graph
    pos=nx.spring_layout(hub_ego)
    nx.draw(hub_ego,pos,node_color='b',node_size=50,with_labels=False)
    # Draw ego as large and red
    nx.draw_networkx_nodes(hub_ego,pos,nodelist=[largest_hub],node_size=300,node_color='r')
    plt.savefig('ego_graph.png')
    plt.show()
